How to make smarter financial decisions by allocating energy costs for any process or product
Frederik Van Leeckwyck on , updated
Find out how to allocate energy costs for individual products, machines or processes, enabling smarter financial decisions and a more effective utilities system. A must-read for any executive in the industry holding the purse and wanting to save a buck.
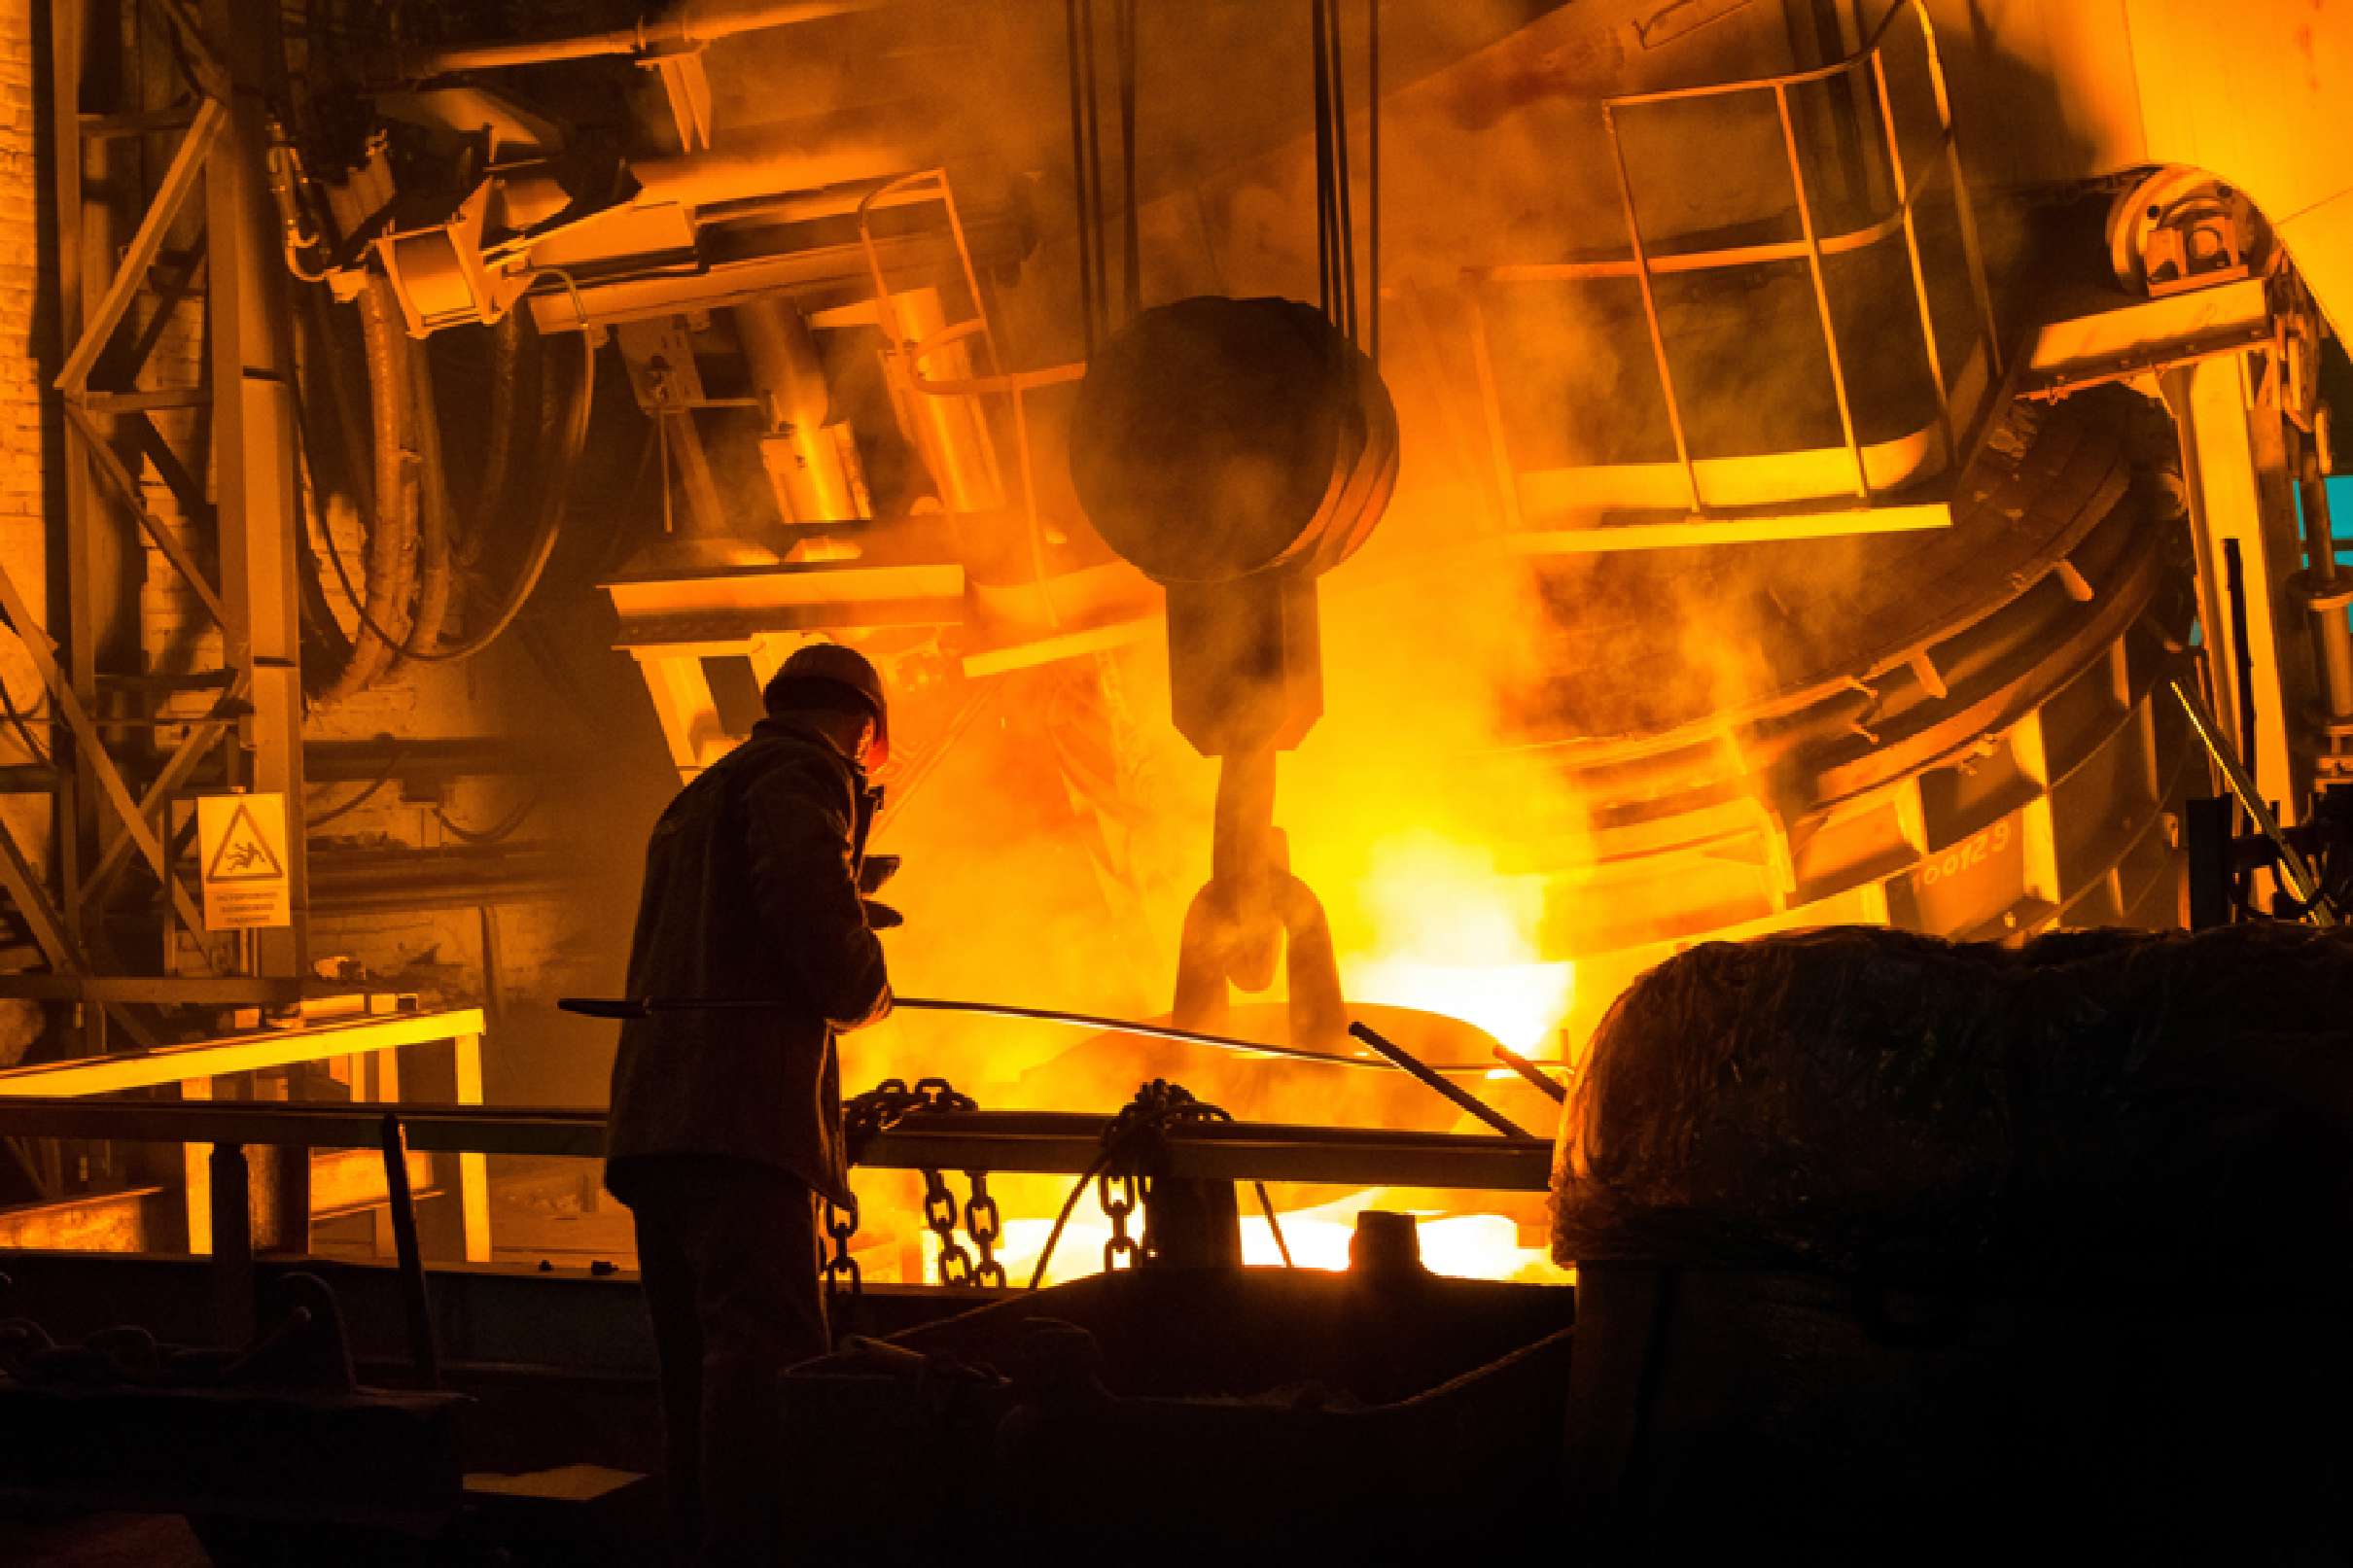
For many companies in the industry, the spectacular increase in energy prices has become unbearable. As a result, some of them have scaled back or even completely shut down production, notably in industries with high energy demands and typically low margins such as the food, metal, or plastics processing industry.
However, and in the midst of an unprecedented global energy crisis, many of these companies lack insights into their energy usage, or the efficiency of their utilities system. In this article, we will explain how to allocate energy costs for each utility, product, machine or process, and how this enables better financial decision making.
What you’ll discover:
- Why adding context to process data is crucial to cope with today’s energy challenges, and how you can do it in a smooth and efficient way
- How to allocate energy costs per product, machine or production line using Factry Historian, enabling better financial decision-making
- How to get more profound insights into the efficiency of your company’s utilities system, and pinpoint new opportunities for energy savings

Why it pays off to review your utilities flow
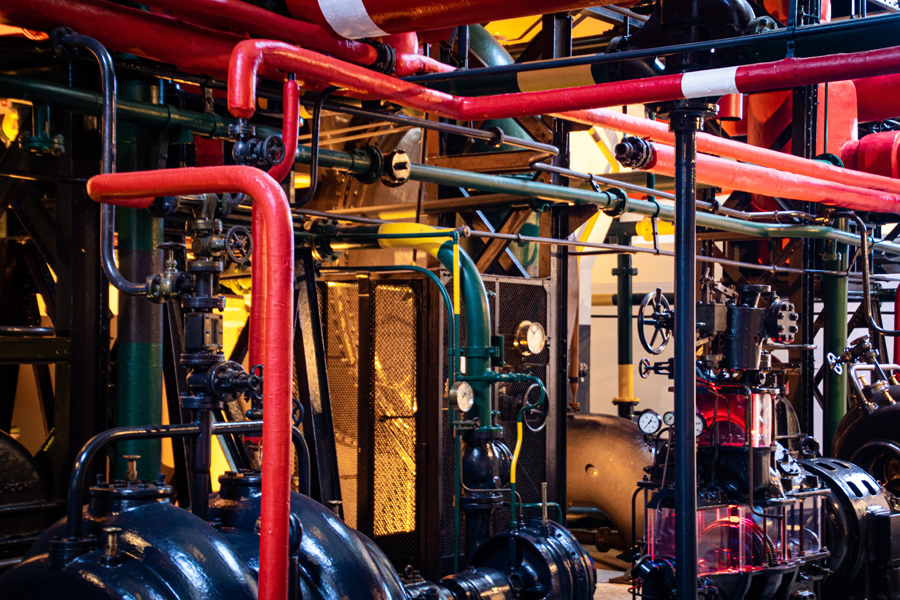
Typically, a factory consists of a production site and an integrated utilities system that generates steam, compressed air, process water or any other type of utility that is needed to support the production process.
From there, you can tell how much gas, water or electricity you’re consuming, either to generate these utilities or to power your production equipment.
While it is very useful to know how much energy your plant is globally consuming, it is just as important to know how efficiently the energy is used within the plant.
Especially when there are tough choices to be made.
For instance, by more accurately attributing energy (and also material) costs to specific product types and equipment…
- You notice your standard energy overhead attributed to the product is higher than the energy used reality. You decide to lower your price to become more competitive, and vice versa.
- You realise some products are hurting your overall profit margin because the direct energy component is actually higher than expected.

Adding context to raw production data: why and how
To obtain the level of insight needed to tackle the previous issues, looking at raw process data alone won’t cut the bill. For this, you will need an additional layer of context to complement the raw data, and make more sense out of it.
While engineers are mainly interested in how well their processes are running, as an executive, you want to hear the other side of the story. Instead of temperatures and pressures, you’ll worry more about questions like:
- How much energy does a specific product cost to make?
- Which products have the highest and the lowest energy cost?
- Why does a production line use more energy than others?
- How does the energy cost of one product compare to others?
- Which production line or asset uses the least energy of all?
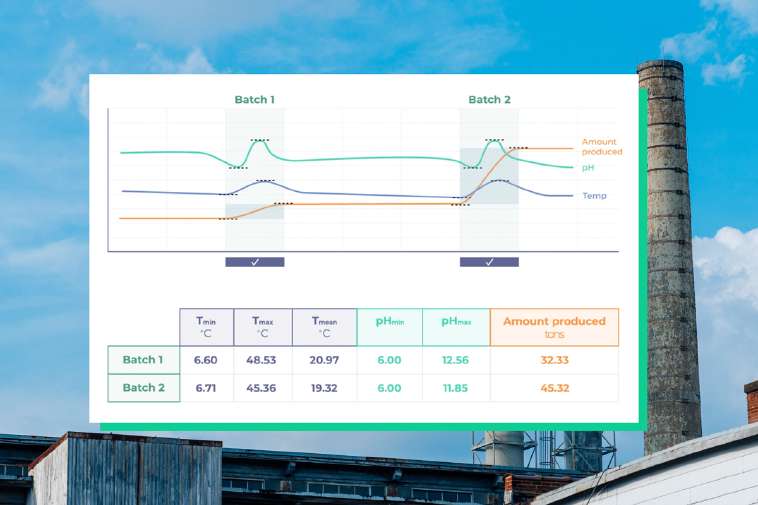
To answer these types of questions, the raw process data must first be ‘contextualised’, identifying events such as products, batches and recipes on specific equipment. This enables you to look at it through a different viewfinder.
In most cases, that viewfinder is a BI tool such as PowerBI or Metabase.
From raw data to valuable insights in a glimpse
The thing with transforming raw data is that it mostly requires custom development, and involves a lot of technical people. In the end, however, only a few people will understand how the system works, making it unfit to scale.
The good news is that Factry Historian does this data transformation for you, automatically. This means you get instant access to advanced insights on energy use, without someone having to write complex integrations scripts.
How Factry Historian drives better financial decisions
Now you’re aware of how much energy is used overall and how much is being used by which asset, process or product, it becomes possible to directly allocate the energy costs, and make better decisions based on accurate data.
This allows you to:
- Lower your plant’s overall energy consumption
- Make better decisions on profitability and margins
- Reach your company’s sustainability goals more efficiently
Now you’ve started measuring energy use, the data can also help people in utilities or facility management. By monitoring and analysing the data, they can pinpoint opportunities to save energy, pick the right time for preventive maintenance, or find out where additional sensors are needed.
Take this example:
Let’s say you use electricity from a supplier to generate compressed air. You have two identical machines that produce the same product, but the one piece of equipment consumes more compressed air than the other. Analysing the data could uncover issues, e.g. leaks that can be fixed easily.


New historian feature: calculation engine
What to do if the number of energy meters or sensors in the production zone is limited? We couldn’t have this hold you back from getting deeper insights. That’s why we built a calculation engine, calculating the usage for you.
This is how it works:
Let’s say there is a set of three machines operating in one division. With our historian’s calculation engine, you can easily tell how much energy the other machines are using, even without an energy meter installed nearby them, by subsequently subtracting the usage from the other machines.
Pretty neat, right?
Deeper insights for every role in the company
In case you hadn’t noticed: the times in which data historians were only used by automation or process engineers, are now long behind us. Today, they can empower any role in the company to get deeper data insights, going from C-level executives to managers, and engineers of all kinds.
Don’t wait until tomorrow to protect your profits
As companies in the process industry are under high pressure, and many of them are facing tough choices as we speak, we bet some of them would make different choices when they had the right data at their fingertips.
Maybe they…
-
could have scaled back production instead of shutting it down, because they knew which products are still profitable
-
would have closed a different production line, instead of the one that would have made more financial returns in the longer run
-
have already saved a substantial amount of energy by identifying leaks or inefficiencies in their utilities system
So, why would you wait any longer to produce smarter and protect your profits?
Schedule a one-on-one demo, find out how to draw advanced process insights from raw production data, and lower your energy use along the way.
Meet Factry Historian
Lower your energy costs through better data insights
Related articles
A client review of our data historian's event detection & analysis module
With our historian's event module, it has never been easier for Lesaffre Group to detect process events such as batches, and aggregate relevant process parameters and KPIs on them. Read the post-PoC client interview.

Client story: a new revenue model with Factry Historian
How EISA leveraged Factry Historian’s data collection and dashboards to develop a new revenue stream, and increase customer satisfaction.

From end station to open IIoT platform: the evolution and future of the data historian
How the data historian has evolved from a bulky and closed production tool to a lightweight and open IIoT platform, enabling companies to beat the interoperability challenges of Industry 4.0.