Start attributing energy use per batch, product, or shift
Connect utilities such as electricity, gas, water, compressed air to production, quality and yield. Get insights into energy usage per batch, shift, or line. Factry is the industrial data foundation that enables energy managers and process engineers to connect, structure, and contextualize data from all sources to enable energy usage reduction for the process industry.


.png)
Go from monitoring utility usage to reducing it with an open data foundation
Energy monitoring doesn't exist in a vacuum. Soon you need to combine it with process data to give it more context. That's where setting up a data foundation with Factry pays back dividends.


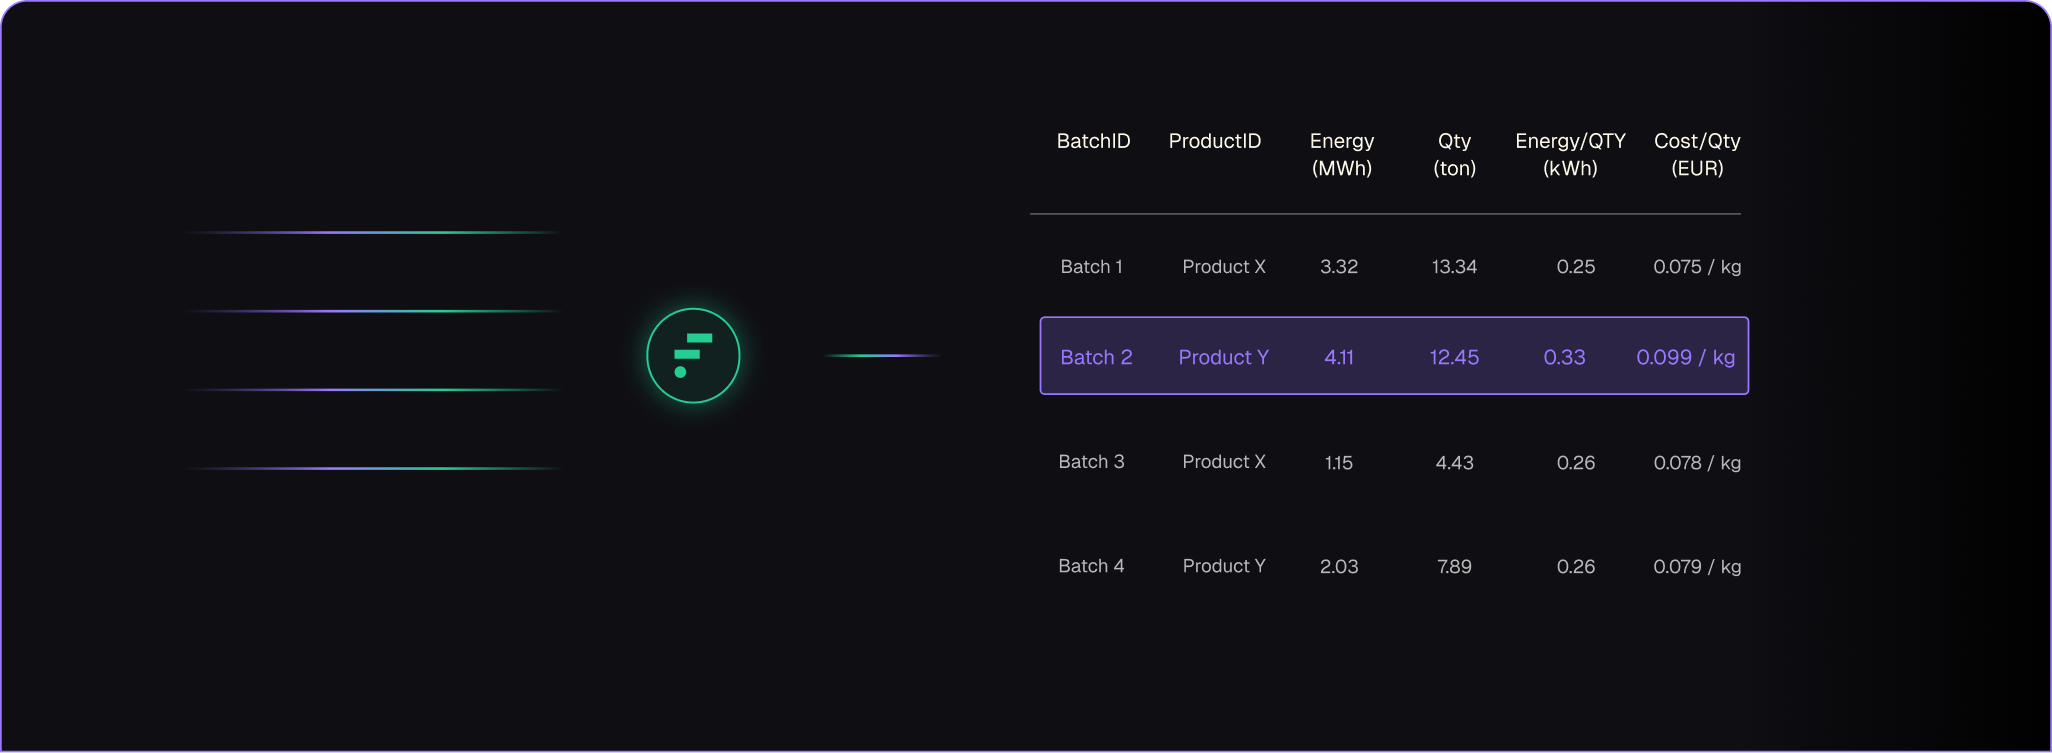
Collect Energy efficiency per batch, product, or shift
Whether it's cost-to-produce, or tracking KPIs, or conducting Continuous Improvement, Factry breaks it down per unit, per batch, or per product, so you can allocate utility costs to products, and take control of your margins.

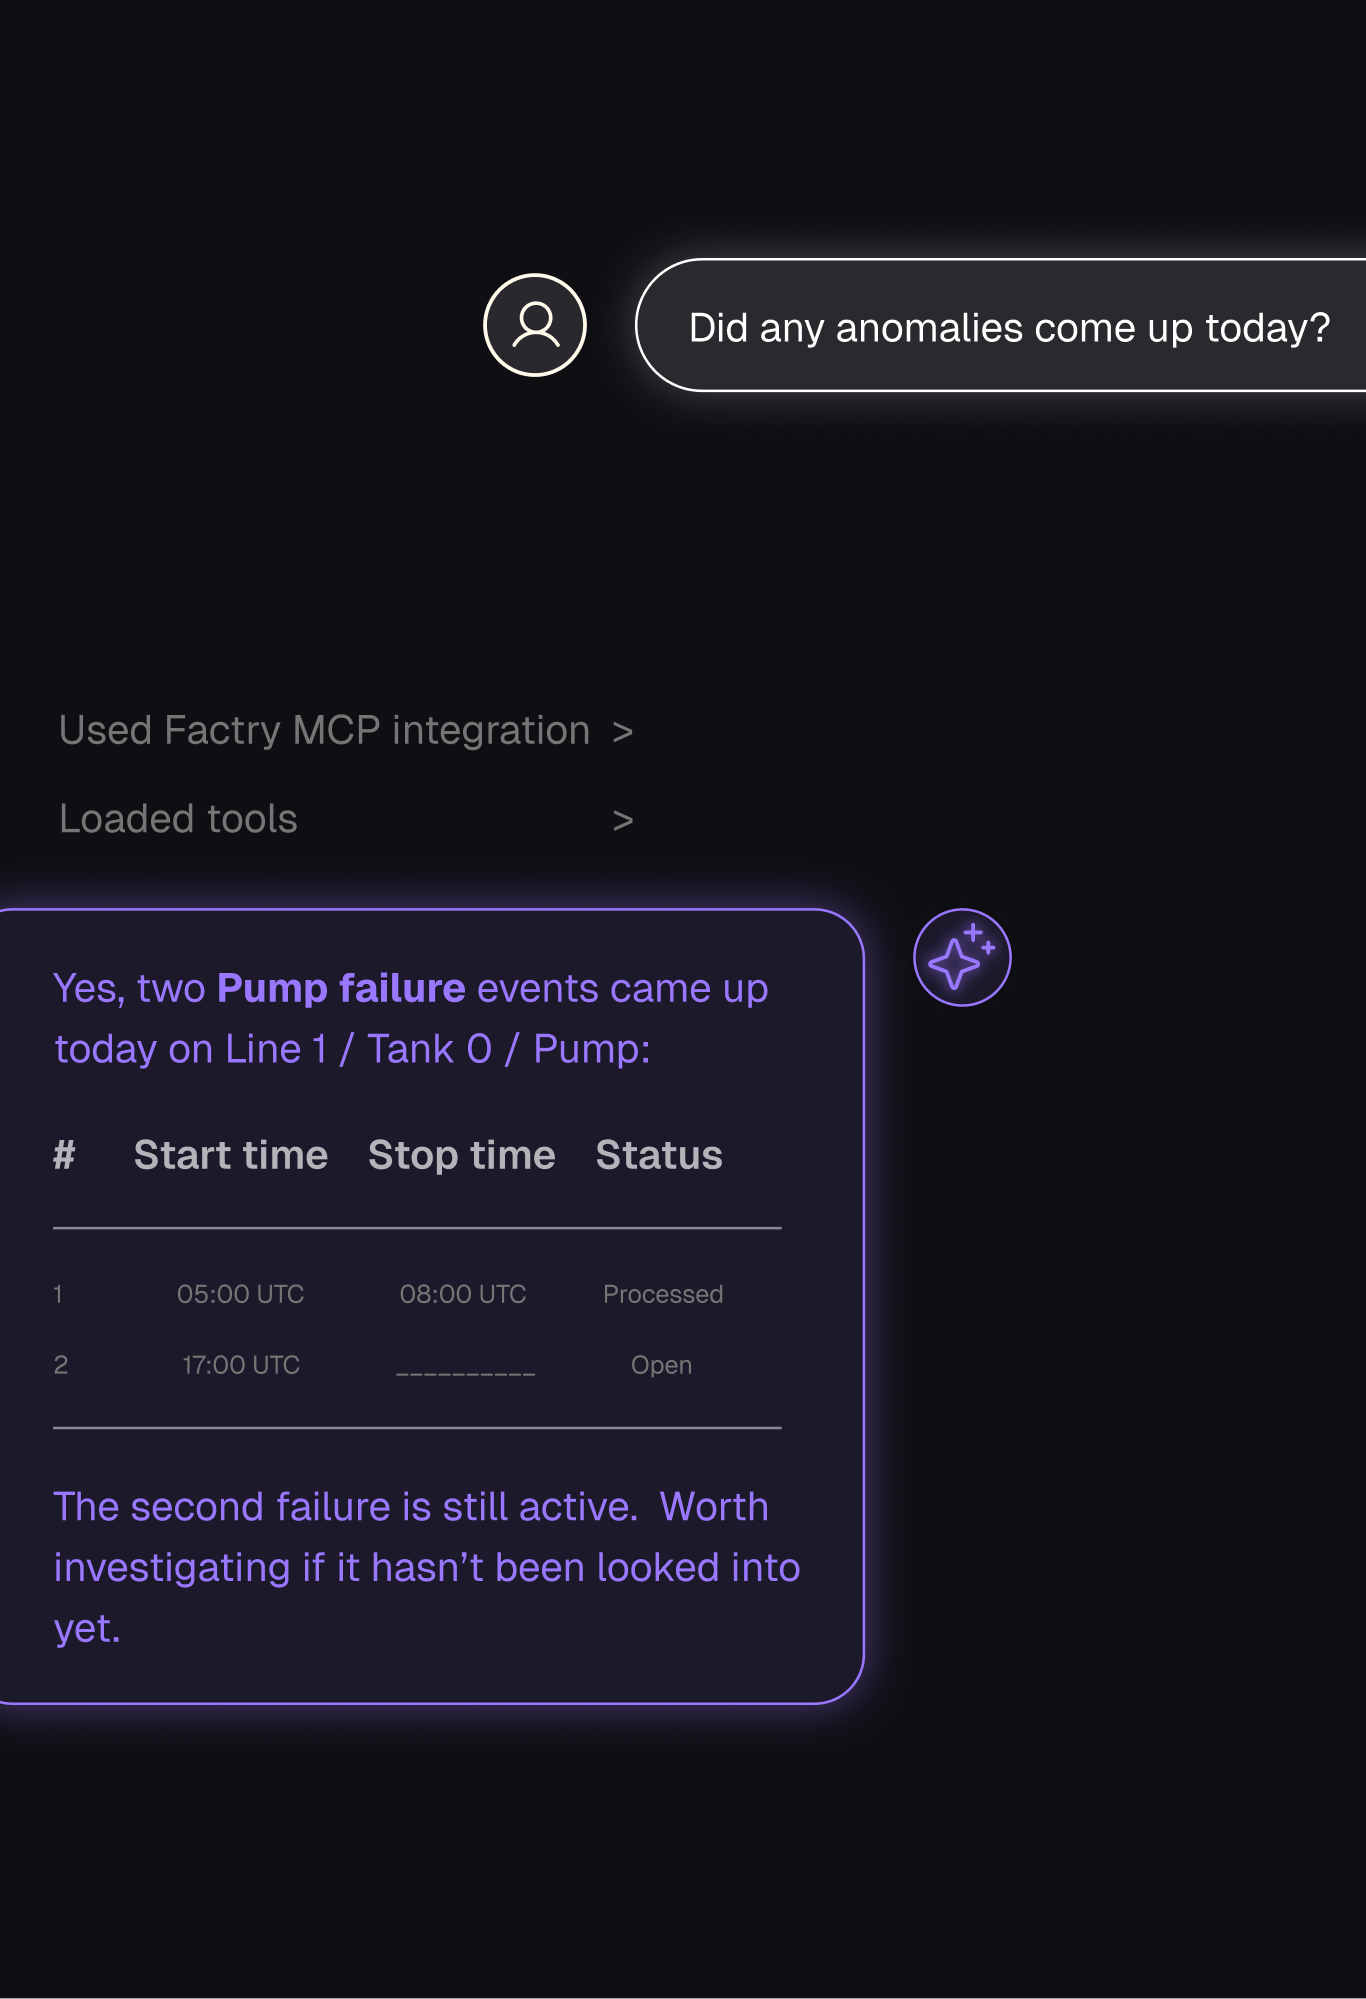
Detect abnormal energy consumption in real time
A batch used 12% more energy? Factry speeds up root cause analysis reducing time-to-insight from weeks to minutes, so you know exactly what actions to take.

Reduce costs by unifying all your data
Factry combines your process data and production data uncovering insights such as the temperature profiles, machine settings, or operator sequences that consistently consume less energy.
No visibility into utilities usage
Energy, water, compressed air, steam, gas and other utilities usage and costs are often not monitored in real-time. If they are, they're looked at in isolation and not linked to the processes themselves. This leads to an inability to address internal operational challenges, compliance and macroeconomic trends.
Rising energy prices and hidden energy costs
Volatile macroeconomic situation are causing energy prices to rise. All the while, there are energy savings hidden in your data that you cannot access.
Similar batches, differing utility usage
Energy, water, compressed air, steam, gas and other utilities usage and costs are often monitored in isolation and not linked to the processes themselves. So any differences are difficult to explain.
Compliance and sustainability reporting
Having to go searching for the numbers every time for sustainability reports or for compliance with energy usage mandates can be painful. Without a shared version of the true numbers, there's no way to know if they're accurate.
The single source-of-truth for all your use cases...starting with Energy Monitoring
Energy waste starts in structural data. The data is scattered across MES, SCADA, energy meters, Excel, and BI. So the data exists without context.
Without the data being structured in a way that reflects how your plant runs, advanced analysis and insights are impossible.
That's what Factry brings for your industrial data: structure, context, trust.
Ask questions to your data
Factry’s built in MCP server connects your data to AI tools your team already uses. This allows anyone on your team to ask questions in plain language and get answers right away.
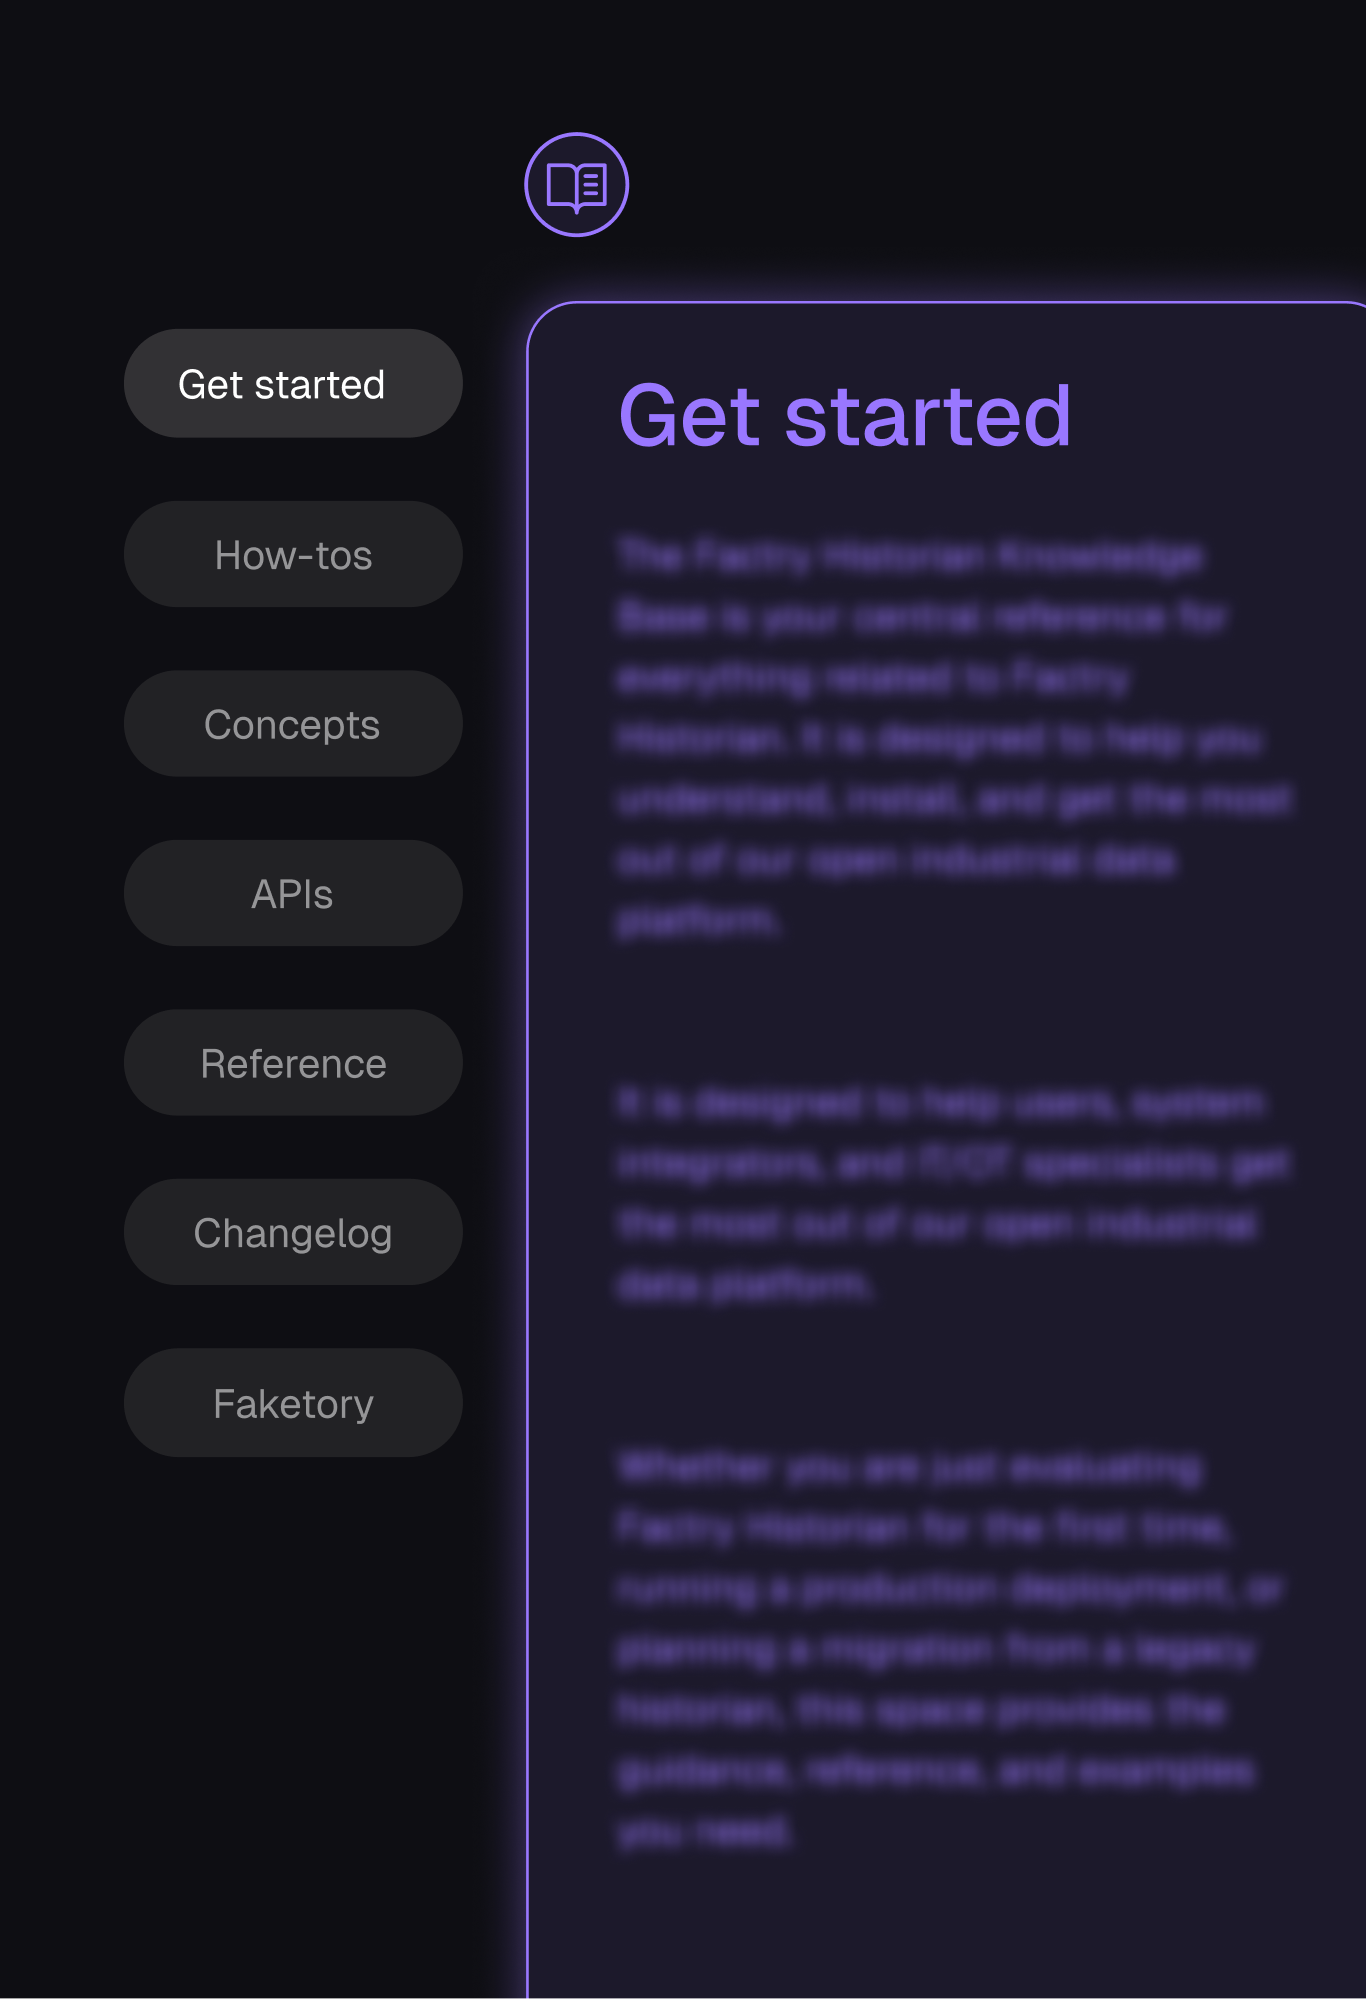
Set up Factry for energy monitoring on your own
Go through this step-by-step guide to set up Factry Historian and your first energy monitoring dashboard. Need more help setting it up? Just contact us.

%20(1).png)
Data Unification: How Three Industrial Giants Solved a Costly Problem
.png)
How manufacturers are cutting their energy bill without guessing
FactryOS v6 is here: Launching a Modern Checklist Experience
Put your industrial data to work
Ready to get started with Factry? Awesome! Let’s schedule a call so you can discover how our platform empowers your operations.