Bring your industrial data to life with Grafana
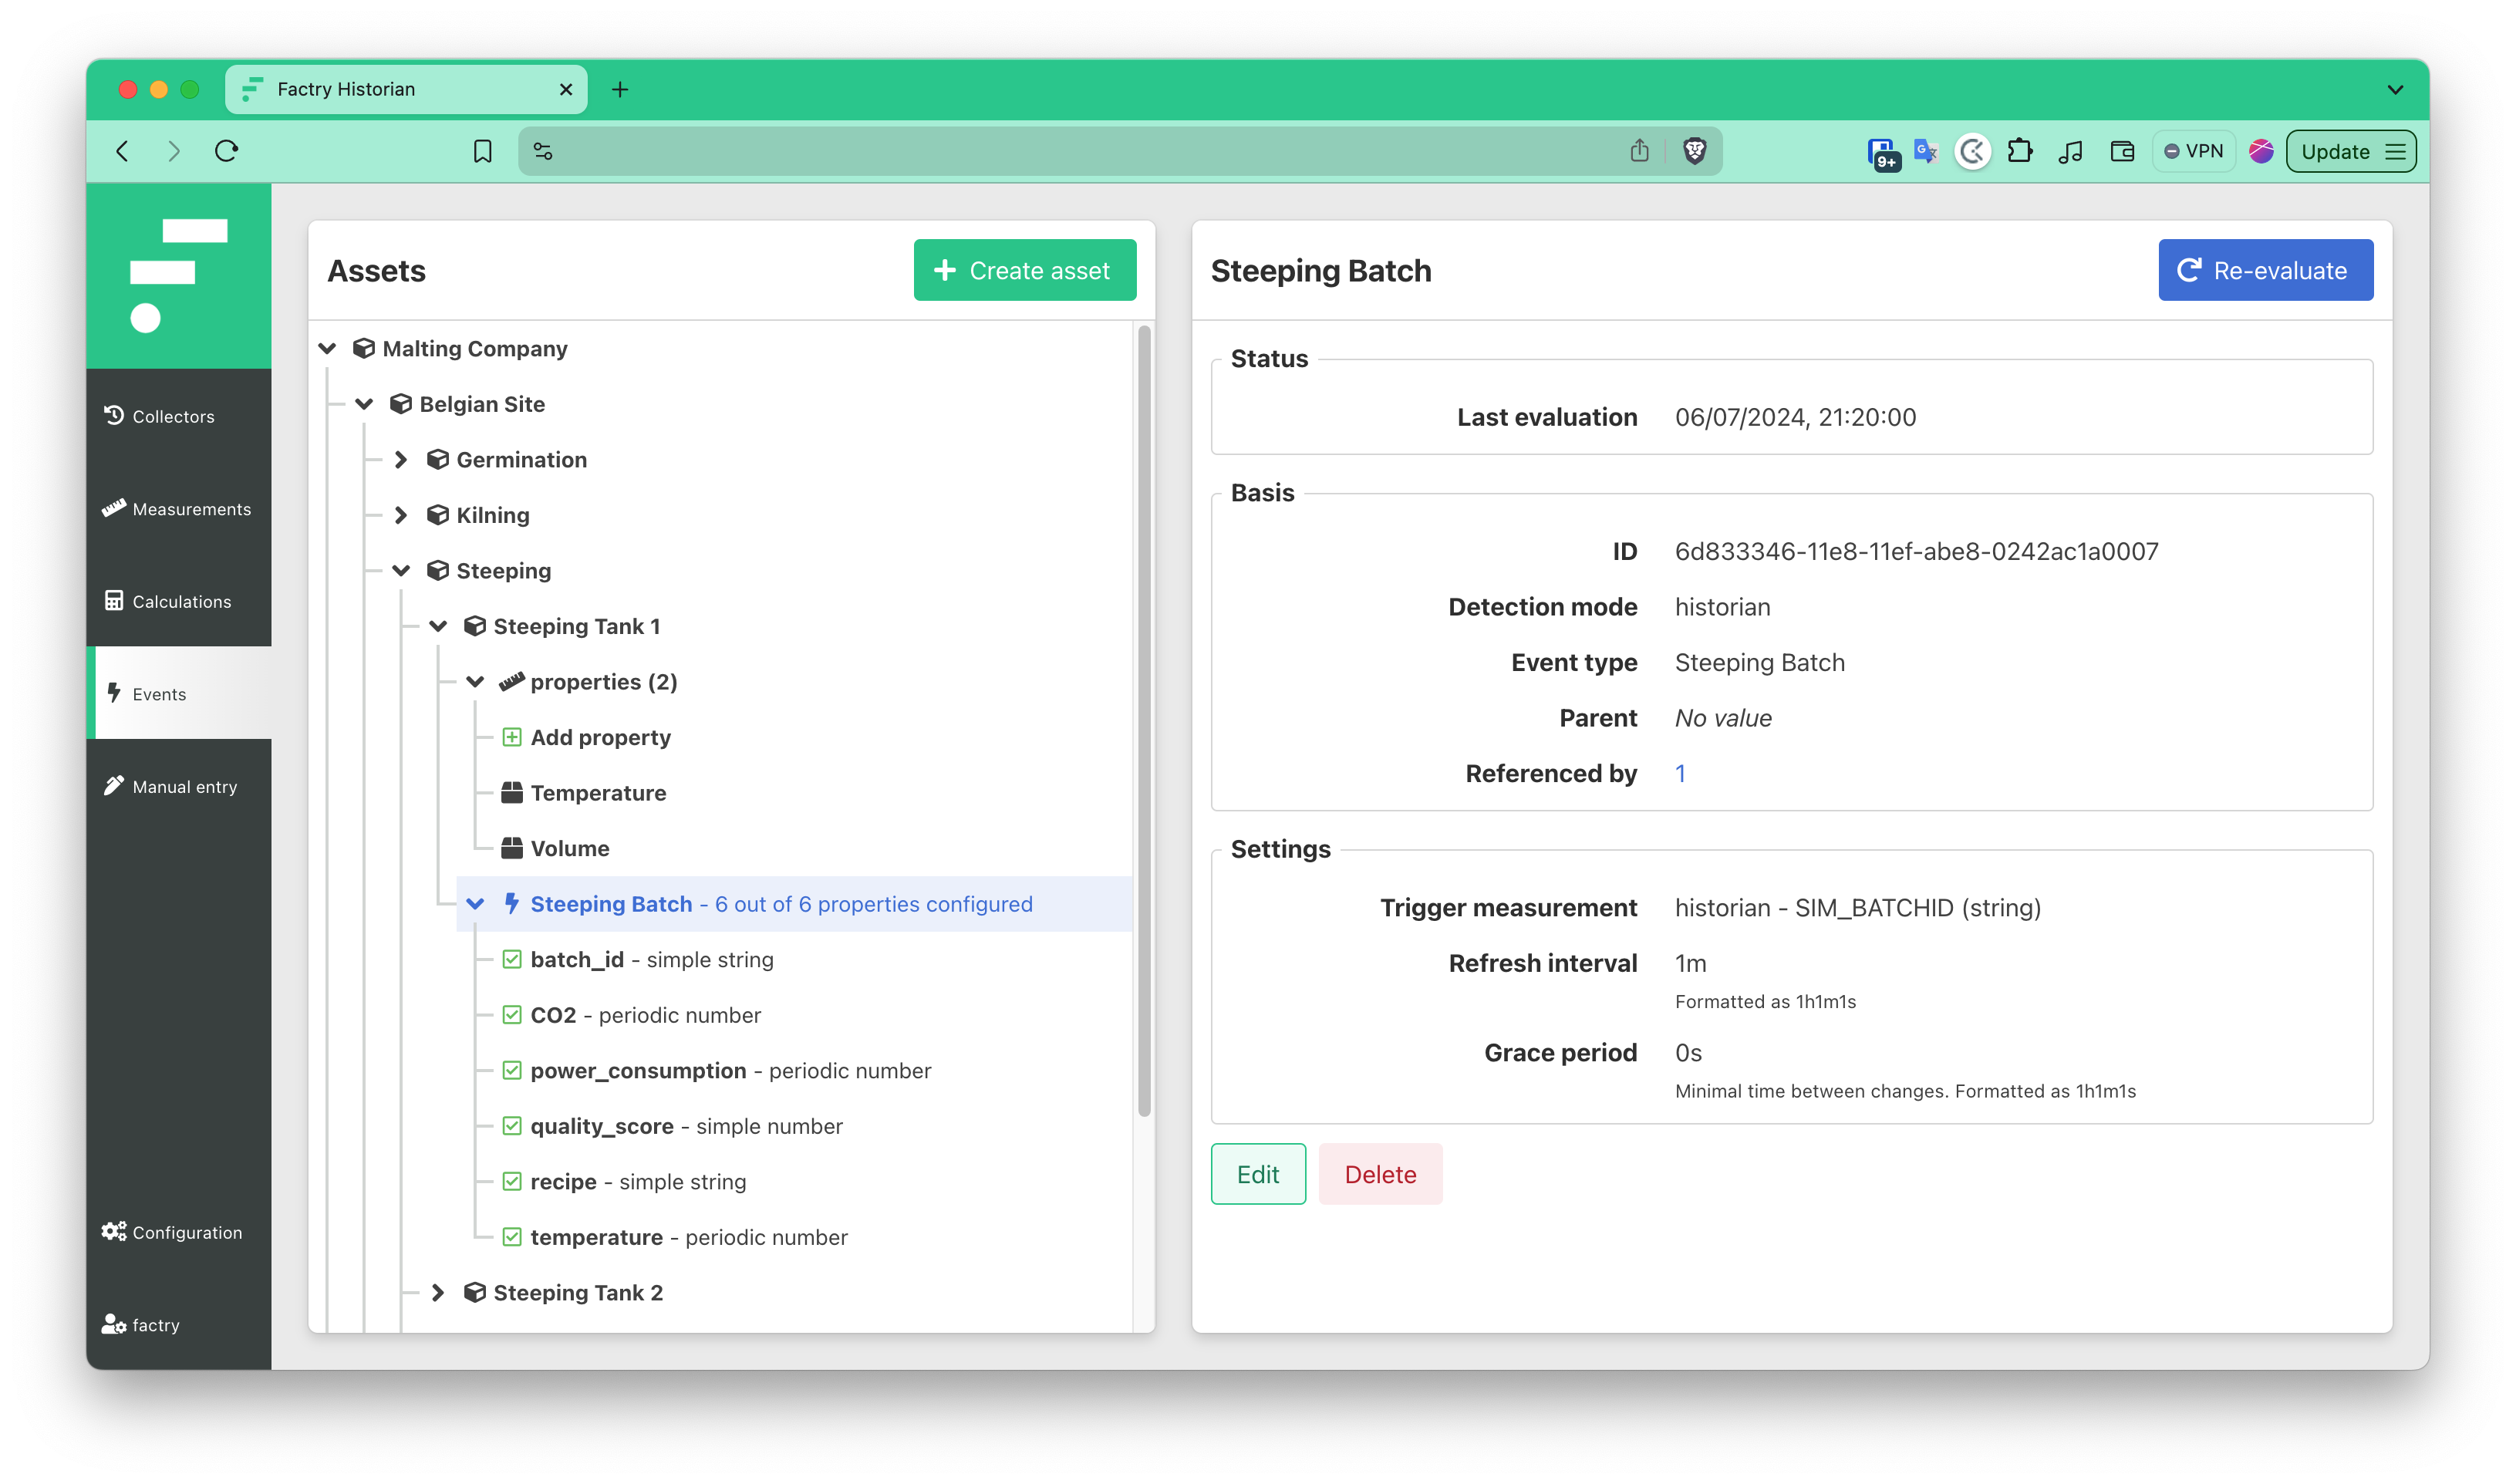
Our Grafana plugin allows non-technical users to visualize industrial time‑series and event data without having to write queries or use query builders. Engineers can browse asset hierarchies, select tags and events, and build dashboard panels in seconds. The datasource plugin supports auto‑loading of units of measurement, axis scaling, and high/low limits to reduce setup time. Overlays makes it easy to compare events like batches or CIP cycles alongside trend lines, so you can visually inspect deviations without jumping between views. Dashboard variables let you filter by asset, batch, or process parameter, making it simple to reuse panels across equipment, sites or other context.

Why we love
Grafana
Medium length section heading goes here
Medium length section heading goes here
Medium length section heading goes here
Medium length section heading goes here
Medium length section heading goes here
Medium length section heading goes here
Native integration with Factry Historian
The official datasource plugin was developed and is maintained by Factry, ensuring seamless compatibility and support with our Historian platform.
Quick insights for non-technical users
Asset structure browsing, units, scaling, and alarm limits come pre‑configured - no manual querying needed. Engineers save time and avoid display mistakes.
Reusable dashboards
Using dashboard variables, you create one dashboard that adapts dynamically depending on the equipment context, saving effort and maintaining consistency across teams.
The Factry Historian Grafana Data Source Plugin: Simplifying Industrial Data Visualization

Put your industrial data to work
Ready to get started with Factry? Awesome! Let’s schedule a call so you can discover how our platform empowers your operations.
