Industrial asset monitoring with Grafana in Factry Historian: 2 real-life dashboards
Jeroen Lavens
on , updated
Asset monitoring isn’t just about keeping an eye on your equipment. It’s a strategic initiative with a huge impact on the bottom line. Here are two examples of how clients leverage Factry Historian dashboards to save money on maintenance, eradicate unplanned downtime, and drive maximum process efficiency.
In this fourth post, we will focus on asset and equipment monitoring using Factry Historian’s built-in, and extremely versatile, visualisation tool Grafana.
Here are two real-life examples of IIoT asset monitoring dashboards, spotlighting clients in the sustainable energy industry. However, these dashboards demonstrate their value in any sector of the process industry.
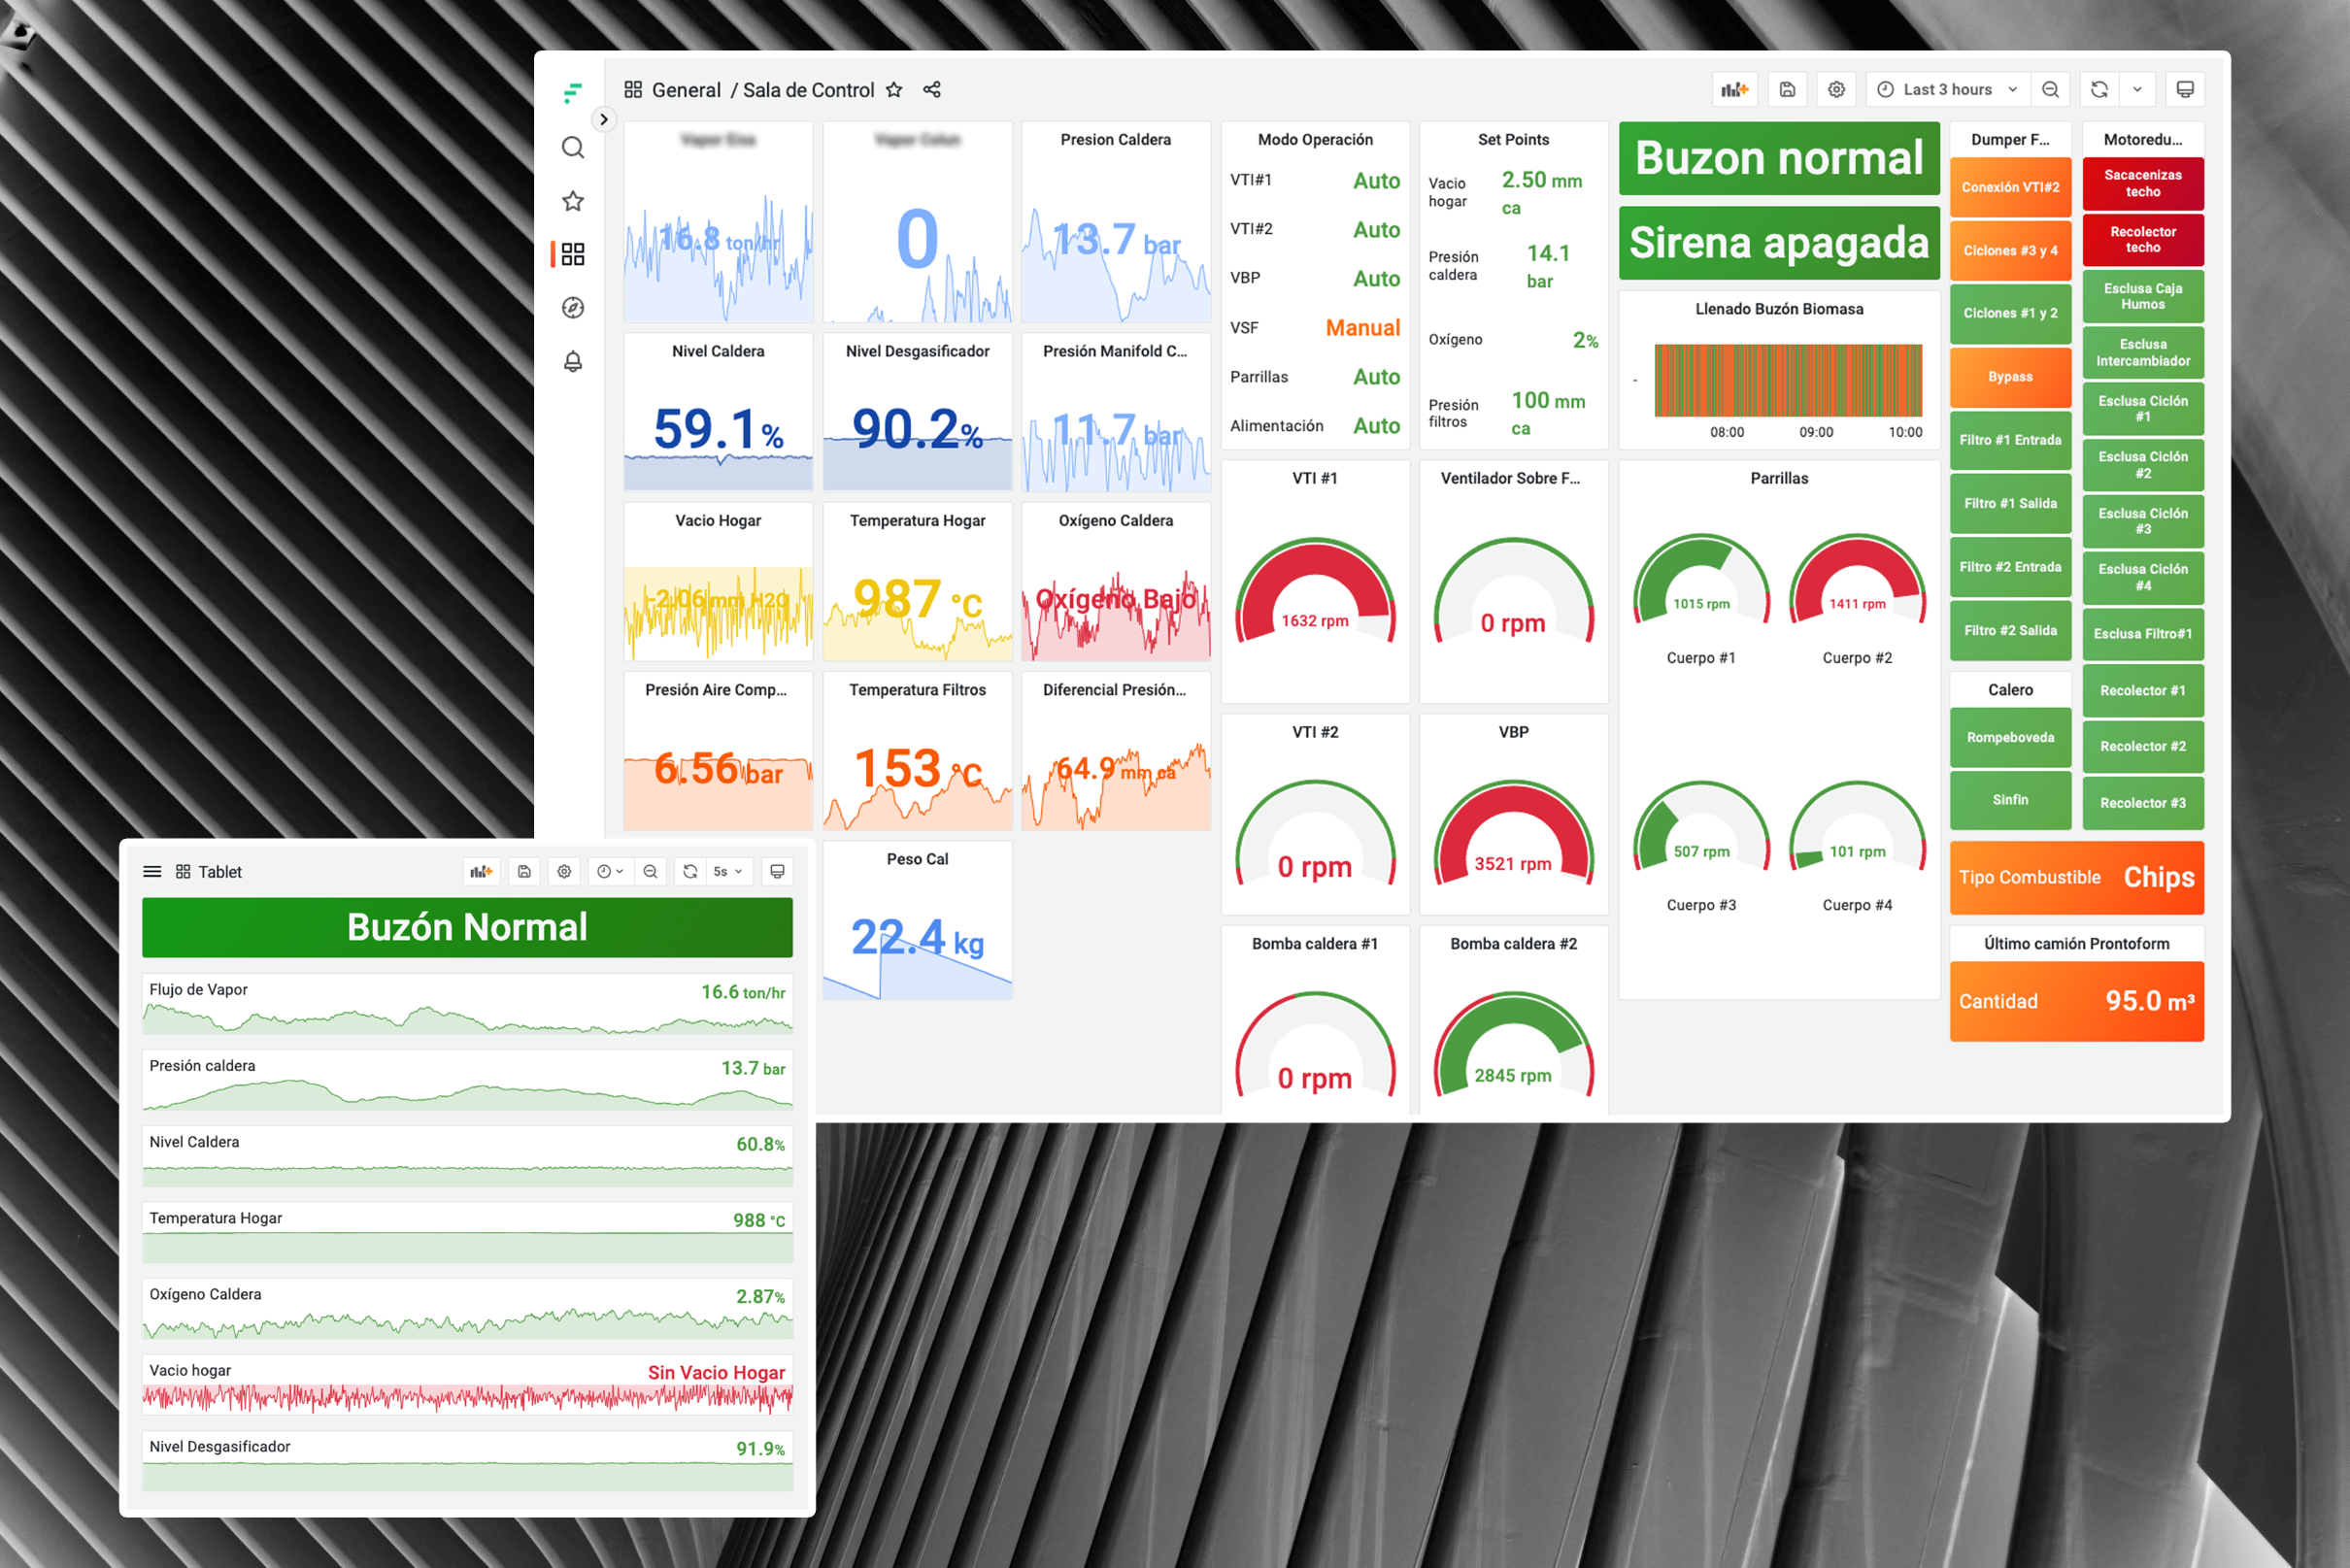
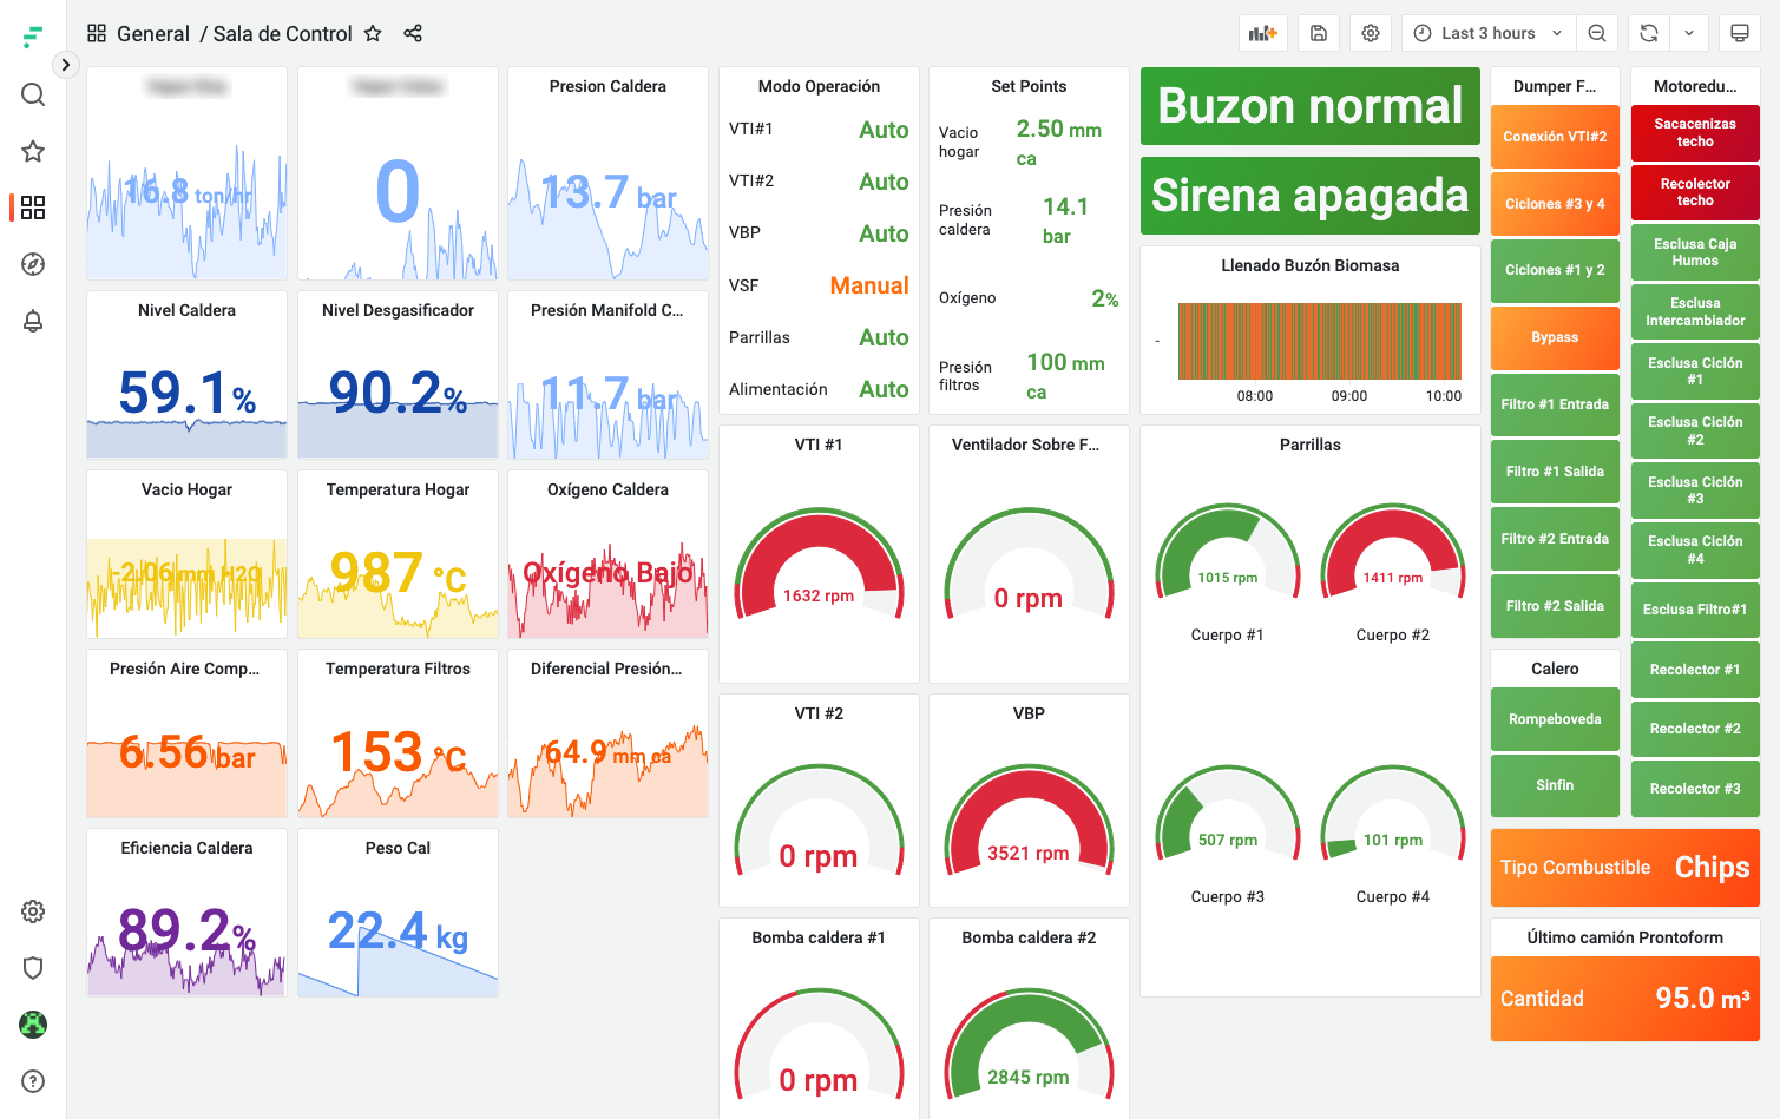
Example 1: monitoring biomass boilers in real-time
Energías Industriales S.A. (EISA) is a biomass company based in Santiago, Chile. Their core business involves selling steam generated by biomass boilers, which they install on-site for their clients.
The company and its customers share a common objective: maximising the production of renewable steam, as it is more cost-effective than generating steam using a gas boiler.
How EISA uses Factry Historian for asset monitoring
▶ Leveraging Factry Historian, they collect, store and analyse data from eight biomass boilers, each with 500 to 1000 process parameters.
▶ Limitlessly customisable Grafana dashboards offer EISA real-time and historical insights into asset behaviour and performance metrics.
▶ Asset status dashboards are also used to follow up on process parameters, such as volumes, temperatures, pressures, oxygen, etc.
▶ In a single overview, managers and engineers can evaluate the performance of different installations, and zoom in on each asset.
▶ EISA also uses the historian to collect data from client equipment, such as gas boilers, e.g. to understand why they are switched on.
▶ In the blink of an eye, intuitive alerts provide instant process visibility, indicating whether certain values are within the desired thresholds.
Advantages for EISA
✔ Whether it is about performance or energy usage, visually appealing dashboards empower EISA with immediate, actionable information.
✔ Through open-protocol communication, EISA can compare data of different biomass boilers, in order to understand its processes better.
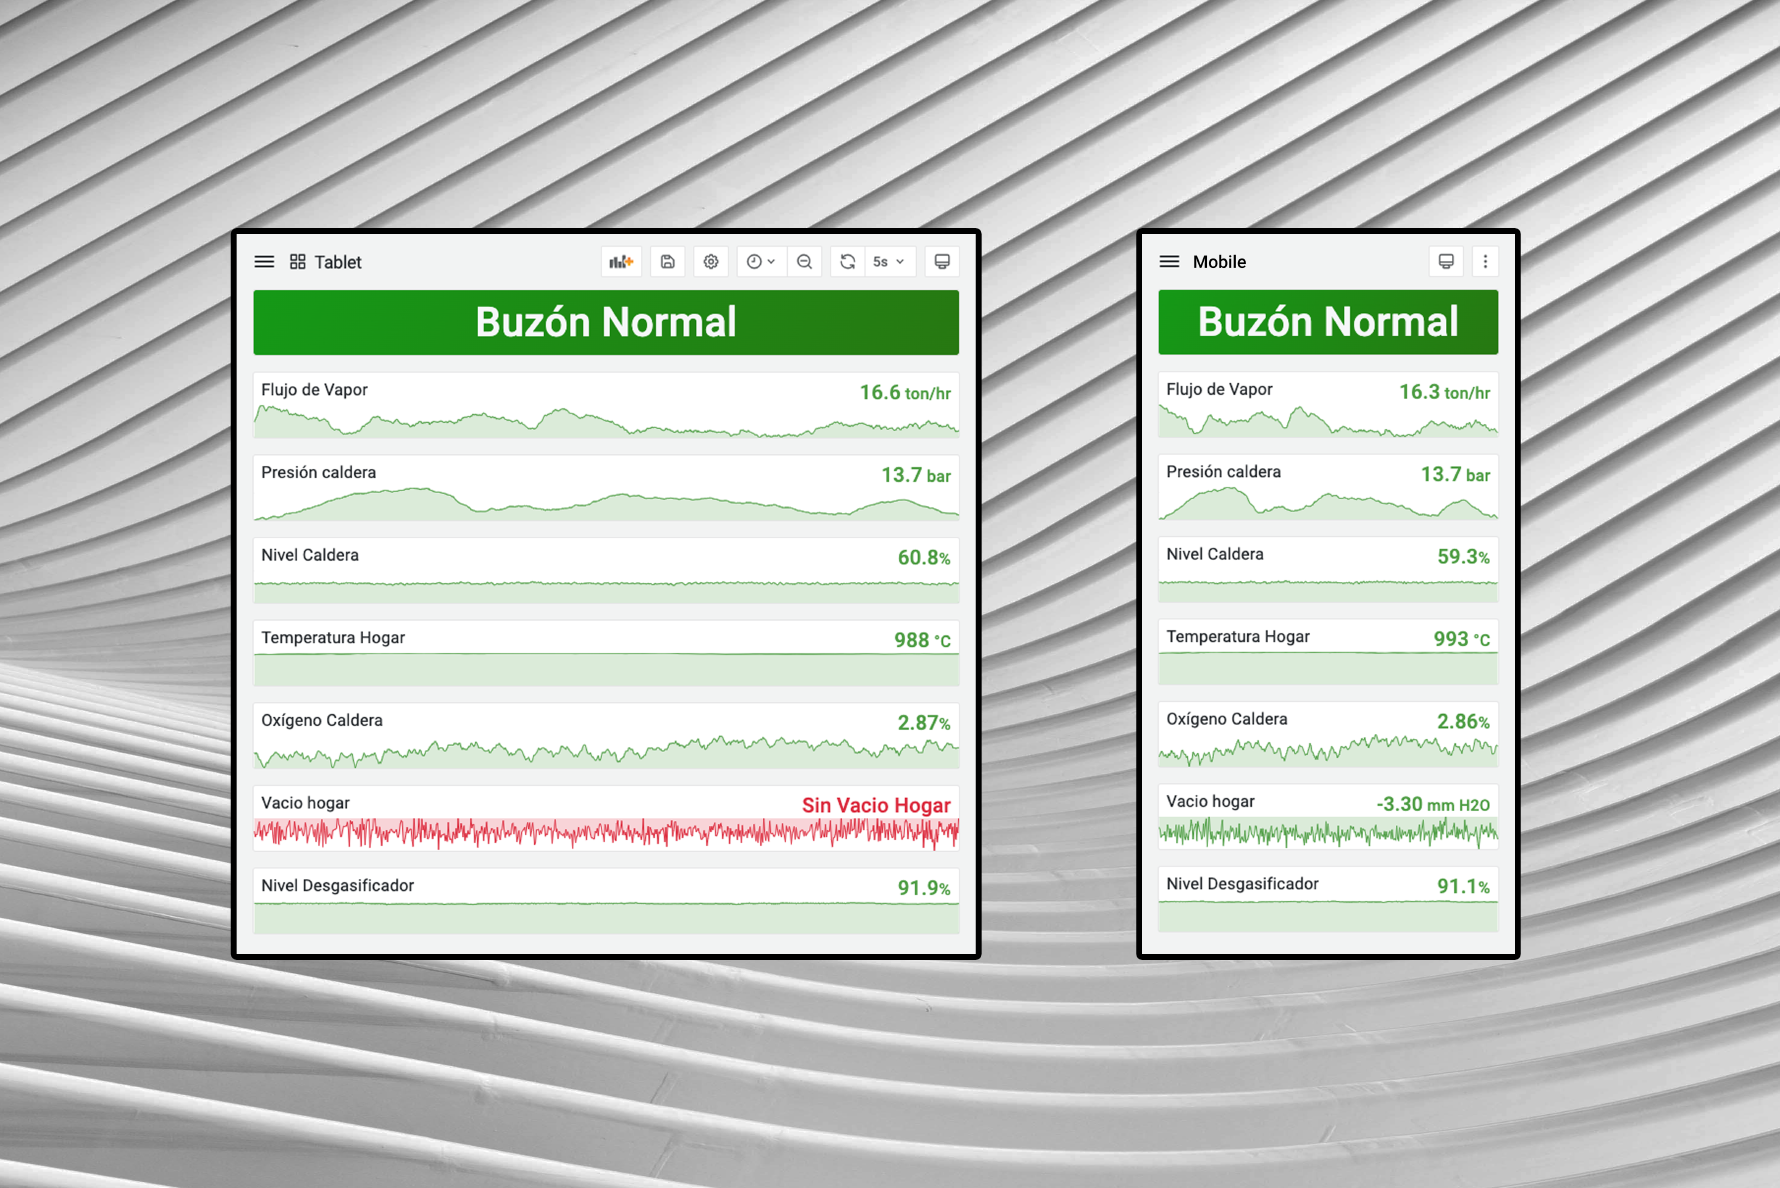
✔ Through a simplified mobile interface, operators can check up on the performance of each biomass boiler, whenever, wherever.
✔ With one glimpse on their dashboards, as well as through instant alerting, potential issues are discovered and addressed quickly.
✔ Without hassle, the company can integrate new sensors, systems or devices, ensuring the dashboards keep up with their requirements.
✔ Whenever a new biomass boiler is built, EISA’s Business Engineer can easily set up fresh dashboards, by replicating and adjusting them.
✔ The historian delivers a single source of information for EISA and its clients. At all times, both parties know exactly how the boiler is running
✔ The historian’s user-friendly asset dashboards have enabled better employee collaboration, while increasing customer satisfaction.
✔ Having accurate data, EISA was able to implement a continuous improvement programme, and measure the result of their actions.
✔ Since the historian can easily be rolled out on a large scale, in a cost-effective way, it’s even included with their smallest installations.
All about Factry Historian
Learn how Factry Historian can help you collect, store, and analyse industrial data
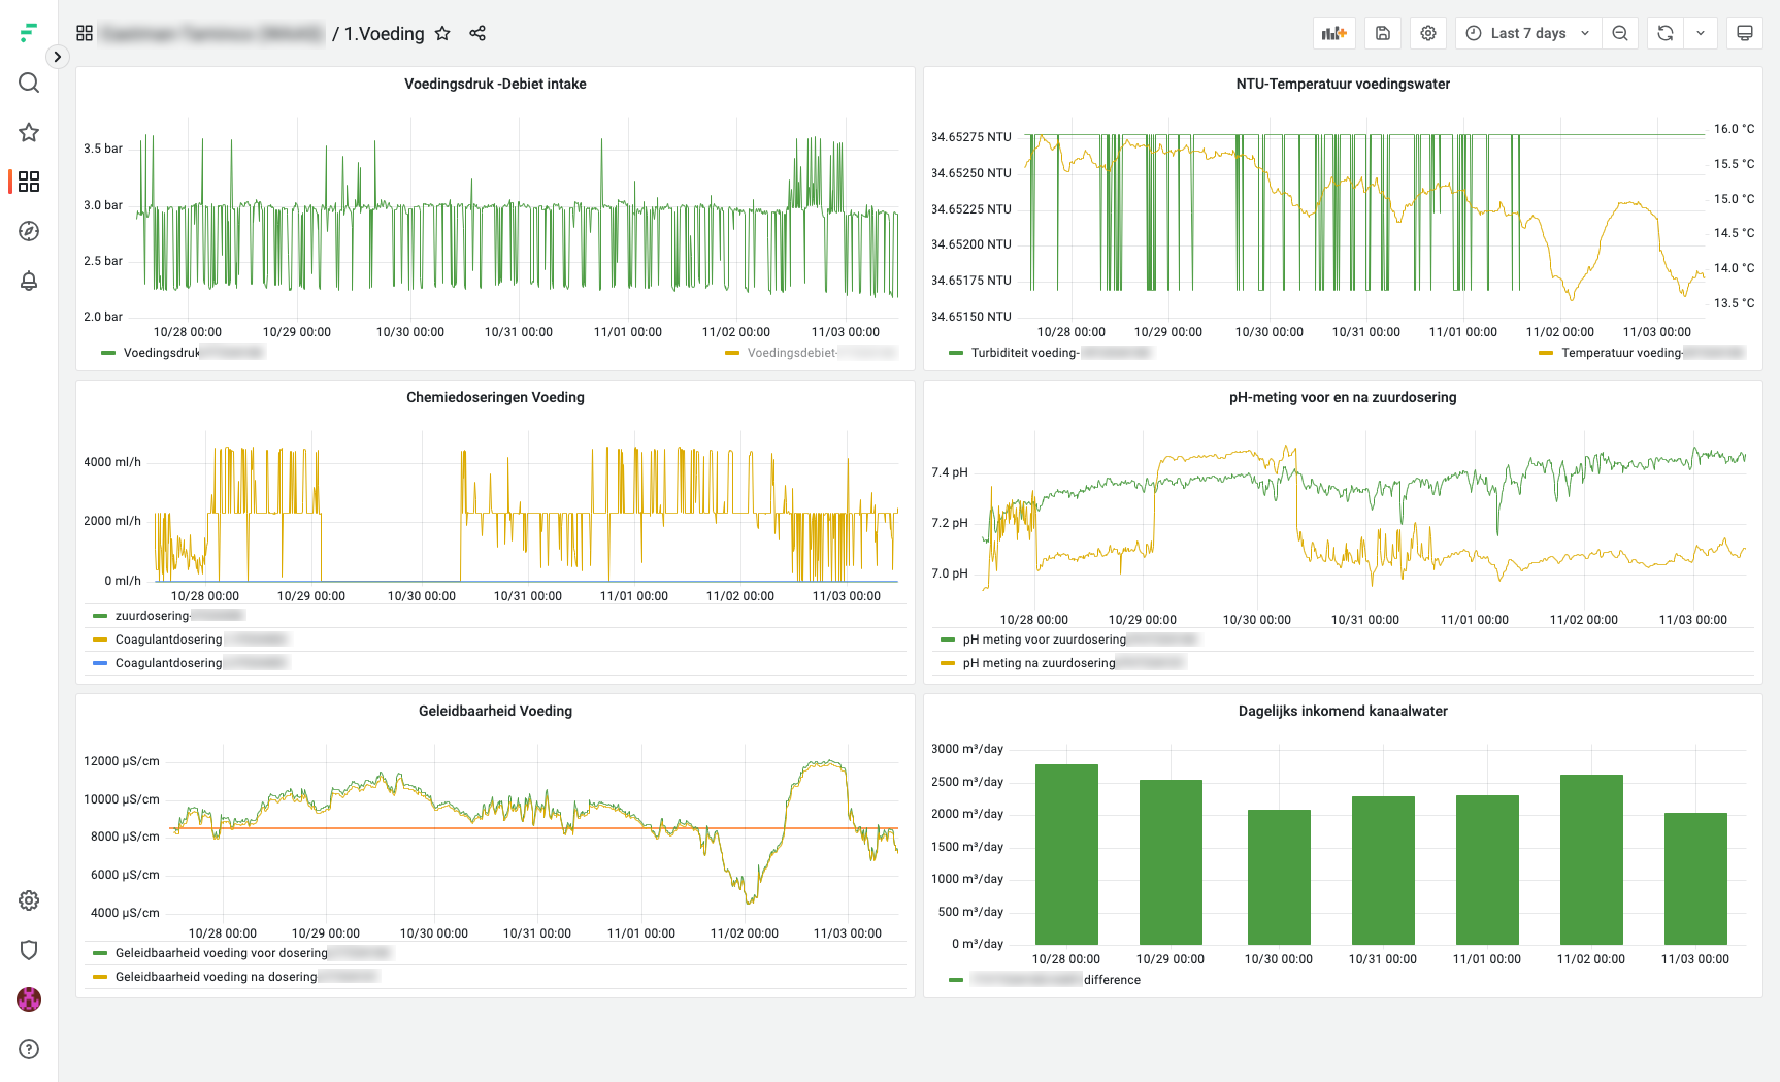
Example 2: Live monitoring of water treatment installations
Ekopak, Belgium’s leading innovator in sustainable water treatment solutions, provides renewable process water to industrial companies.
Building its own installations on-site with clients in various industries, the company core business is to deliver process water within certain parameters.
To manage its many assets, efficiency is key. With hundreds of installations spread across the country, Factry Historian’s rapid and efficient scaling truly shines.
How they use Factry Historian
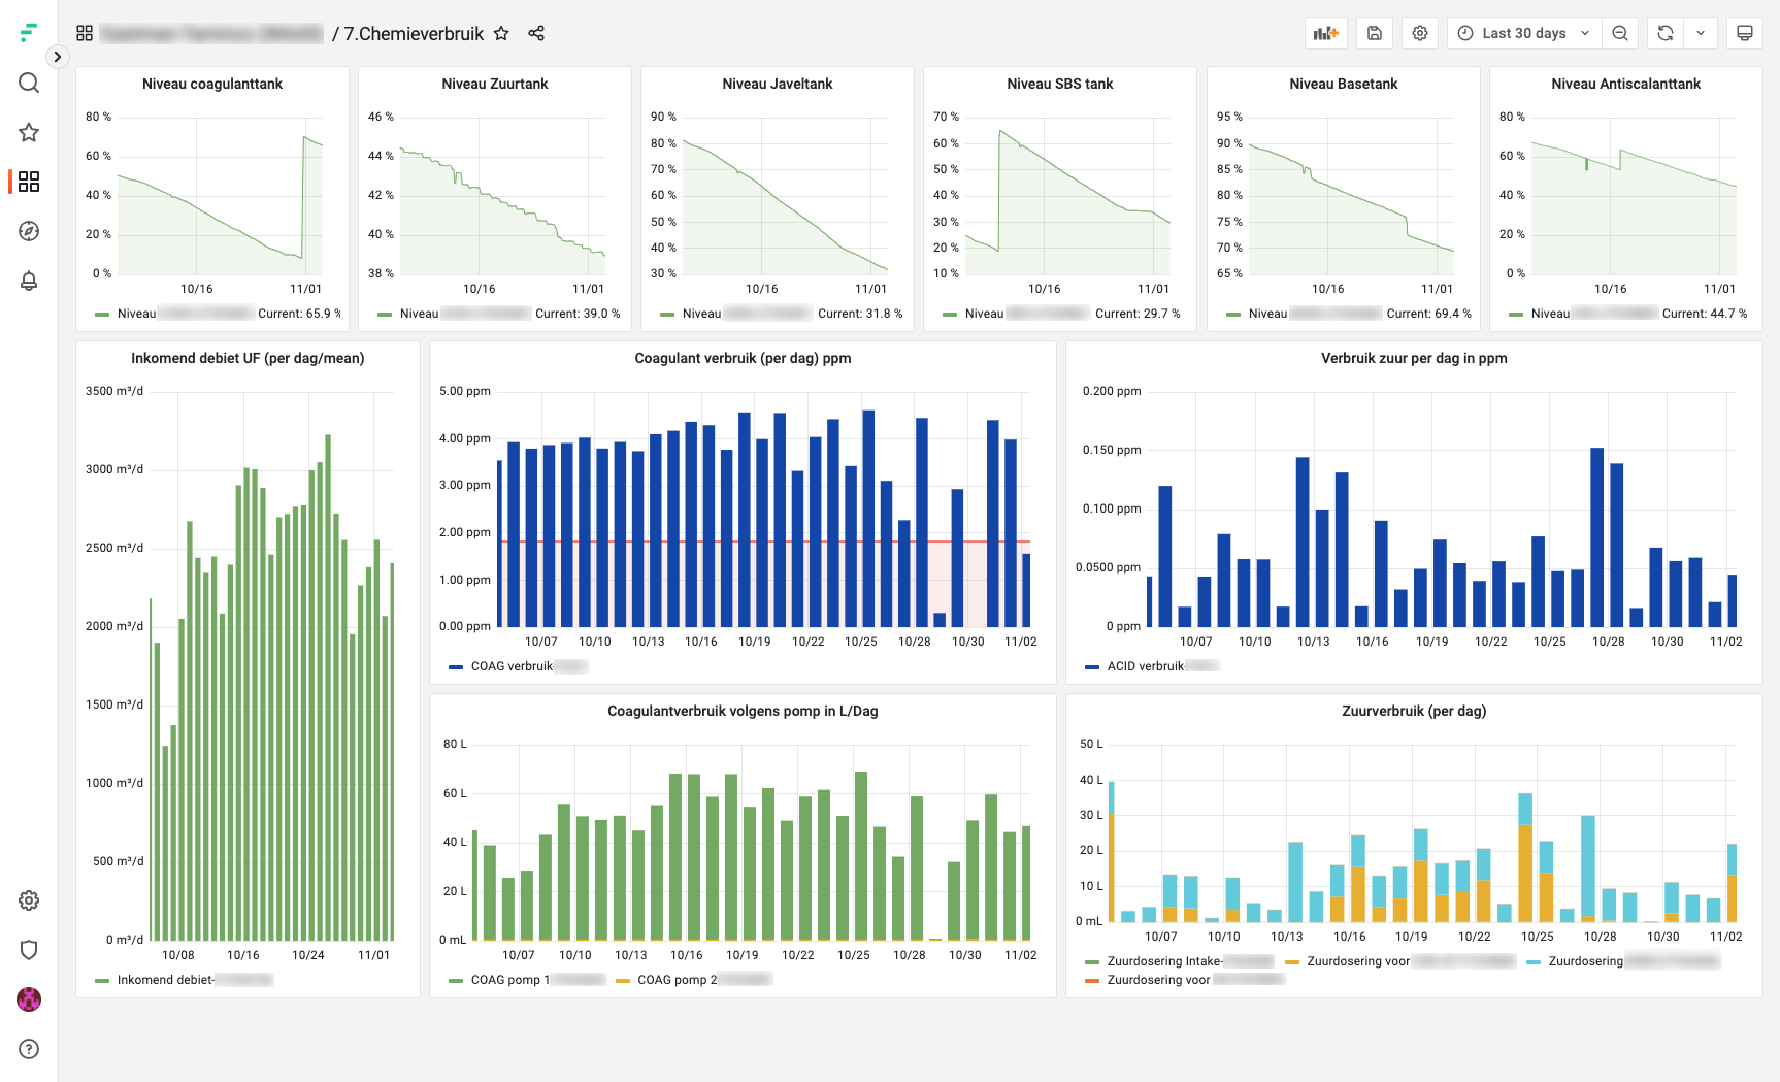
▶ Ekopak uses customisable dashboards to monitor critical values such as volume, flows, pH values, pressures, or other parameters.
The dashboard above shows a single installation at one of their clients.
▶ In case of deviating equipment or quality values, the right people are immediately alerted through a text message, email or notification.
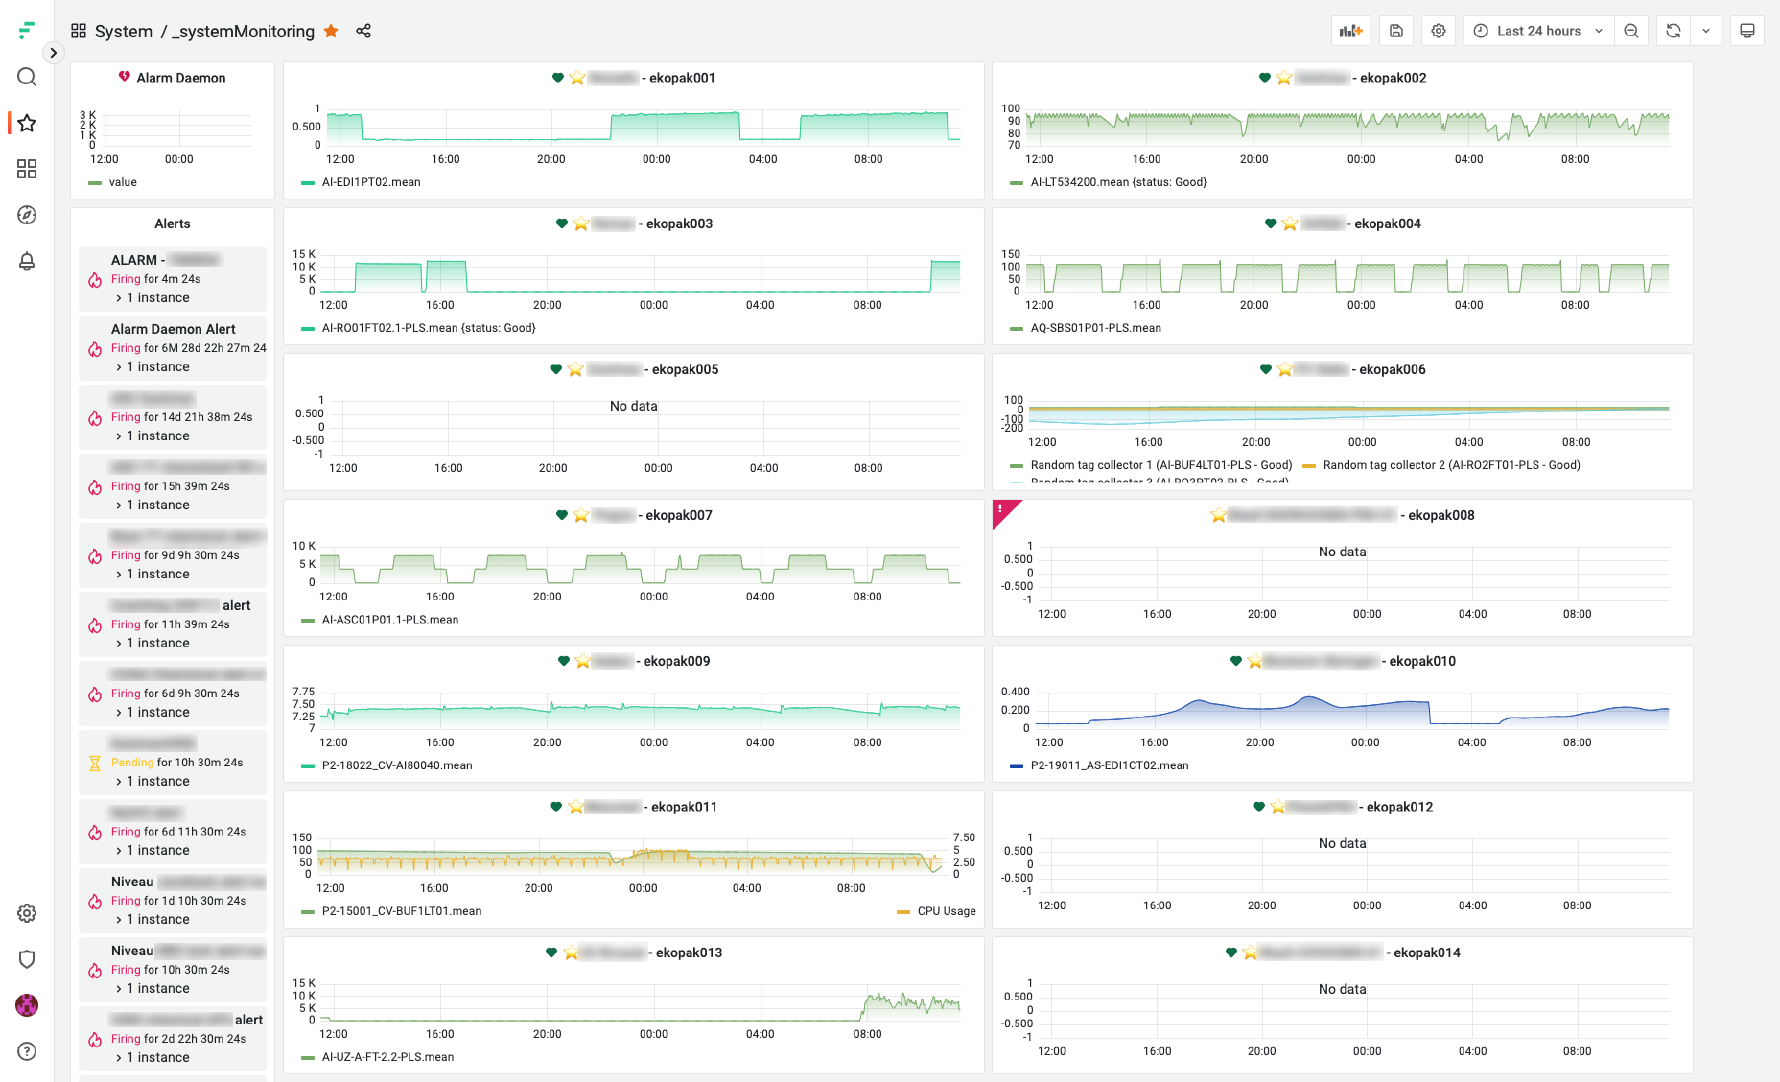
▶ The dashboard below shows a clear overview of key metrics for multiple installations, offering a bird’s eye view of operations.
Advantages for Ekopak
✔ At all times, Ekopak has detailed insight on how their installations are running, while offering 100% data transparency to customers.
✔ By analysing real time and historical process data, they are able to accurately schedule preventive maintenance of their installations.
✔ Since Ekopak employees are instantly averted in case of deviating values, potential issues can be fixed before they become problems.
✔ Through accurate data collection with Factry Historian, Ekopak is able to invoice correctly, and continuously improve its operations.
✔ Ekopak can provide remote data access to third parties, such as suppliers or technicians, enabling them to work more efficiently.
✔ With each new installation, a fixed series of Factry Historian dashboards can be set up in minutes, by simply copy-pasting and adjusting them.
The bottom line
Industrial asset monitoring with Factry Historian transforms equipment maintenance from a reactive task into a proactive, strategic initiative.
While other solutions often lack usability, can’t talk with older systems, or can’t be scaled cost-effectively, the open technologies on which Factry Historian is built, are designed with scalability and interoperability in mind.
And, the bigger the scale, the bigger the benefits.
In summary, monitoring production assets with Factry Historian, has enabled EISA and Ekopak to:
Make data-driven decisions
Prevent potential breakdowns
Lower maintenance costs
Minimise unplanned downtime
Improve OEE performance
Optimise energy consumption
Eliminate returning issues
Extend the lifespan of equipment
Increase customer satisfaction
What’s more…
Data collected with Factry Historian also enables predictive maintenance strategies, to predict when machinery might fail or require maintenance.
So, if you’re planning to ramp up your digital transformation efforts, collecting, storing and visualising data, Factry Historian is a great place to start.
All about Factry Historian
Learn how Factry Historian can help you collect, store, and analyse industrial data