With Factry Historian v7.3, we’ve focused on the essentials:
- Cut configuration time considerably with bulk asset & property imports.
- More powerful Grafana integration.
- Advanced filtering, parent-child event logic, and SQL expressions to build smarter, drill-down dashboards
- True time-weighted average for streams with sparse data
Discover how these enhancements make Factry Historian better.
Added bulk import of assets & properties
Previously, administrators had to create and configure each asset and its properties one by one. A manual, click-intensive process that introduced a risk of misconfiguration.
With Factry Historian v7.3 you can now import and export entire asset hierarchies including parent-child relationships and properties, in one go.
Simply download the spreadsheet template, and add multiple assets, their parent/child relationships and asset properties in advance and let the system validate the structure and apply the configuration in seconds.
The result? No more sore fingers from manual clicking and a much lower risk of configuration errors. Designed for administrators and deployment teams, it ensures consistent setups across multiple sites and cuts setup time.
Grafana datasource plugin refinements
Building on the existing Grafana Datasource plugin, Factry Historian v7.3 delivers a number of small but meaningful improvements:
- Parent event filters
Filter child events based on attributes of their parent event for deeper, context-aware analysis in Grafana panels.
Example: Show only the filling steps of a reactor when the parent batch used recipe “X”.
- Expanded filtering options
Override time ranges directly in event queries and filter by data type. Perfect for building dashboards that cut through the noise.
Example: Always display last week’s batch data, regardless of the dashboard’s global time range.
- Bug fixes and usability tweaks
Common issues, such as dropped queries under heavy load, have been resolved. Tooltip descriptions and error messages are clearer.
- Compatibility with Grafana 12 Beta’s SQL Expressions
Power users gain the ability to write SQL-like expressions directly in Grafana, combining multiple series and performing inline transformations. This opens a world of advanced queries without altering your dashboards.
What's new for these SQL expressions?
SQL expressions now work not just on event data but also on time-series data. You can perform inline without modifying dashboards or pre-processing data in Factry Historian. This helps to reduce complex chains of transformations to a single, readable SQL expression
Example use cases where you'd want to use this:
Combine streams for total flow or energy usage, apply conditional logic across series, calculate performance indicators on the fly, ...
Time-weighted average for sparse data
If you have a setup that reports by exception (which is often the case with MQTT), sensors emit changes only when values differ. Traditional arithmetic averages can misrepresent such “on-change” streams.
Factry Historian v7.3 introduces a time-weighted average calculation: each reading is weighted by the duration it remains valid, not just by its occurrence count.
Why this matters
Imagine a freezer whose thermostat reports only when temperature shifts by 0.5 °C. If the unit spends most of an hour at 20 °C but logs just two readings there and one at 15 °C when it dips briefly, a simple average skews toward 15 °C. A time-weighted average respects the fact that the freezer held 20 °C for the vast majority of the hour.
This feature ensures accurate performance metrics, compliance reporting and anomaly detection in any scenario with irregular sampling, whether food processing, batch manufacturing or remote asset monitoring, via event-driven protocols.
Looking ahead
The v7.3 release reinforces our commitment to steady, user-driven improvements. In the months ahead, expect:
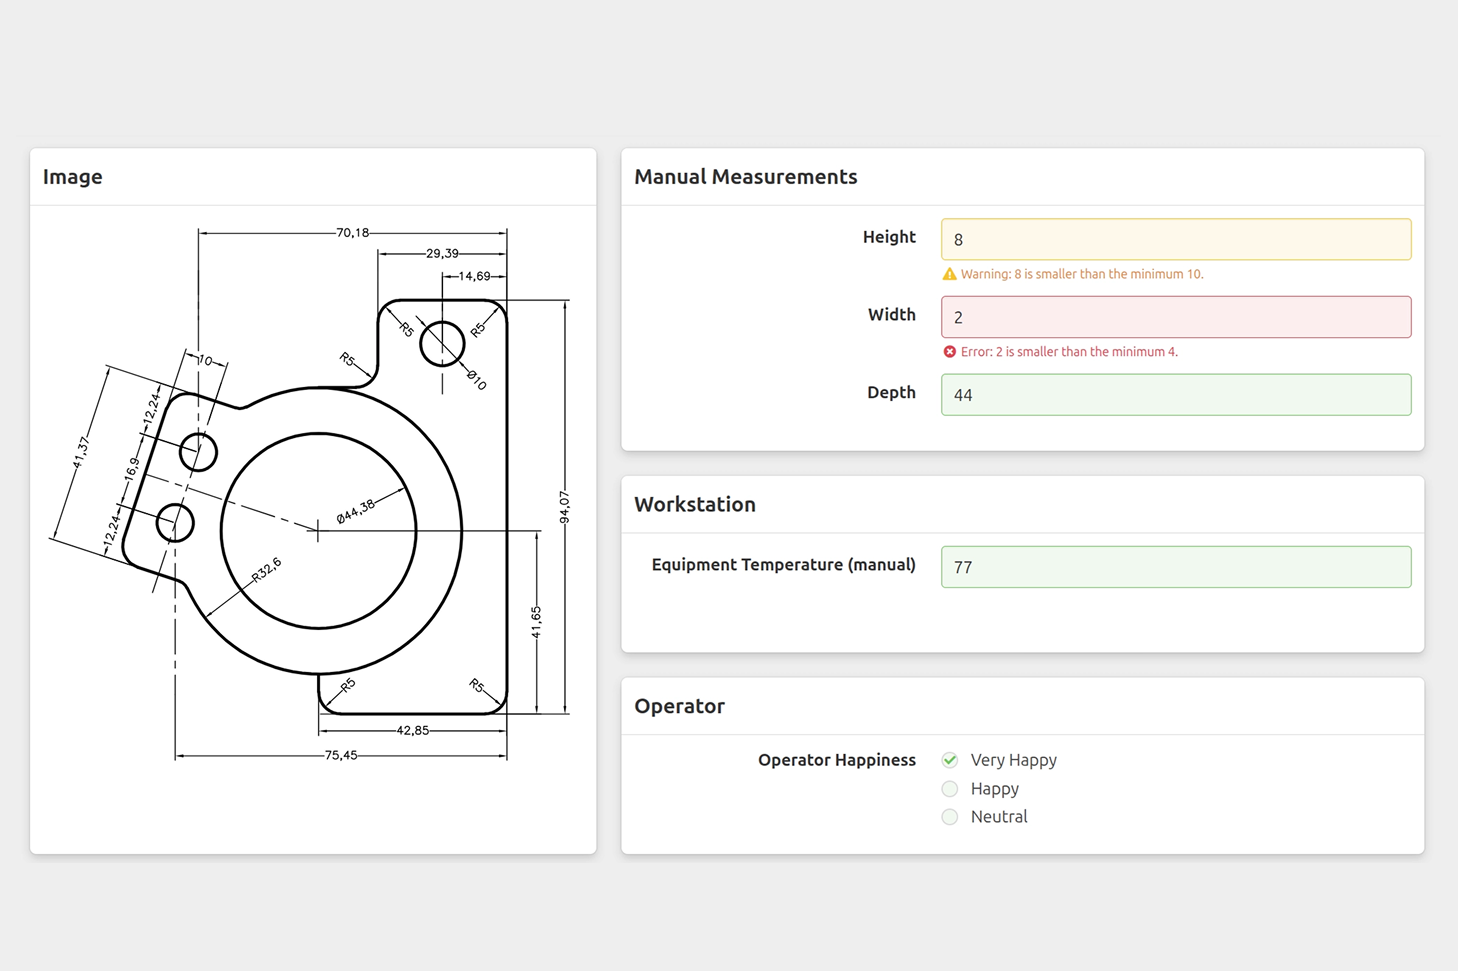
- A redesigned single-screen configuration UI. Featuring inline error alerts, contextual tooltips and a faster setup experience.
- Expanded support for calculated event properties. Script new measurements, such as efficiency or performance indices, directly within Factry Historian.
- Deeper support for sparse data workflows. Including more back-end tools for advanced time-series transformations.
%20(1).png)
.png)