Discover four essential types of Grafana dashboards used by our clients, and how they use them to reach operational excellence and improve OEE performance.
Visual data dashboards are an essential element in the toolkit of production companies, because they provide real-time visibility into key process variables, such as production rates, quality metrics, asset efficiency, and water usage. With this actionable information at their fingertips, companies can quickly identify and address process issues that may impact operations.
Factry Historian + Grafana dashboards: a heavenly match
Through the versatility of the Grafana dashboarding tool, the possibilities for customisation are limitless. However, there are a few dashboard types which almost no client can resist building. Here’s a look at 4 essential Grafana dashboards in Factry Historian used by our clients in the process industry, increasing OEE performance, operational efficiency, and profit margins.
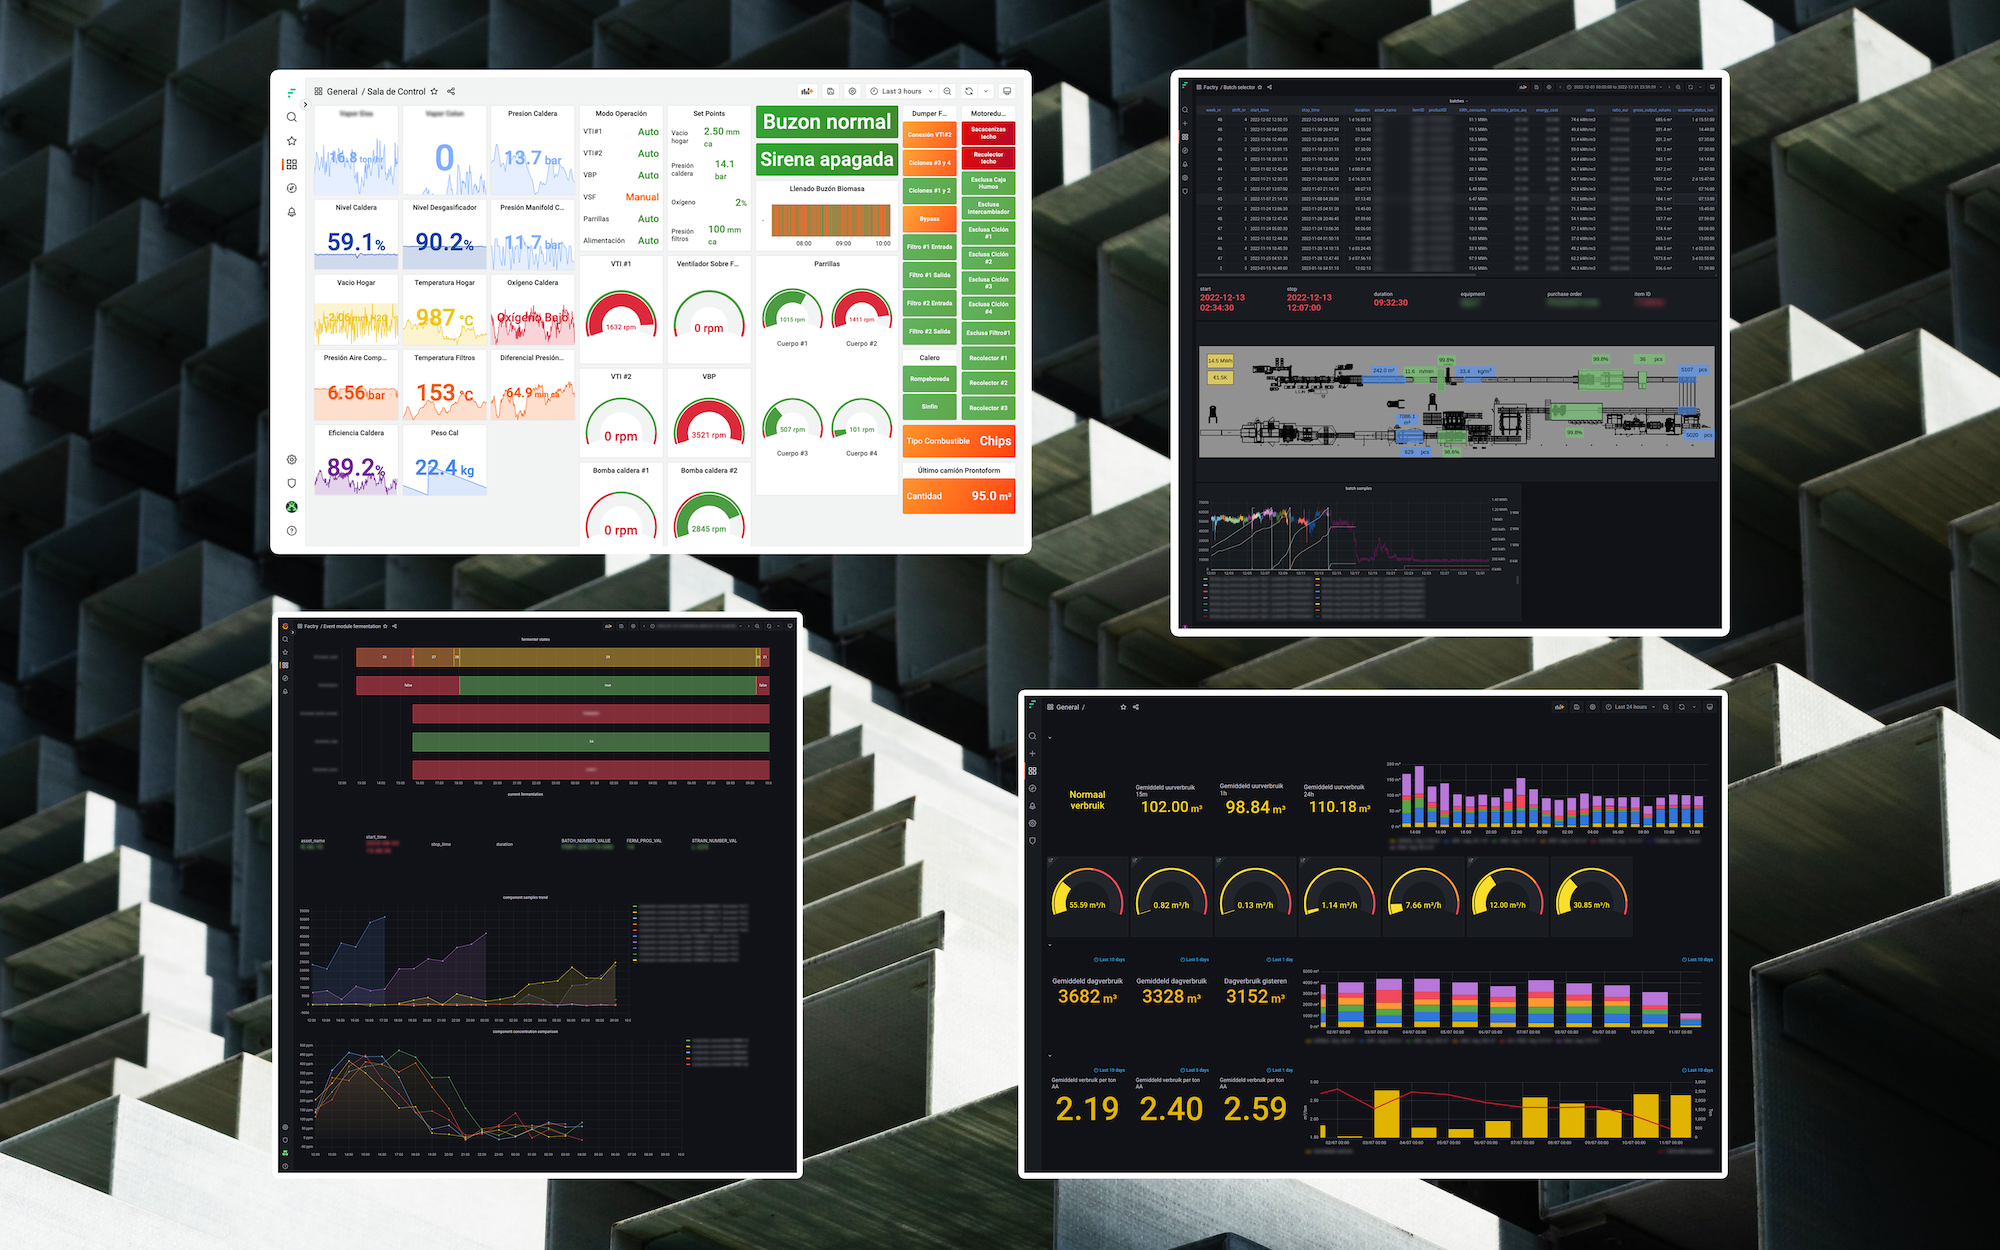
Four essential Factry Historian dashboards
- Production monitoring dashboard
- Water monitoring dashboard
- Batch analysis dashboard
- Asset monitoring dashboard
What is Factry Historian?
Factry Historian is a comprehensive solution for collecting, storing and analysing industrial data. By integrating and aggregating data from equipment, systems and processes, actionable manufacturing insights come to life. Customisable dashboards provide frictionless access to real-time and historical production data, for every role in the company.
This paperless approach allows for a continuous process improvement cycle, leading to increased efficiency, minimised unplanned downtime, and higher profitability.
1. Production monitoring dashboard 👁
Any production manager knows: accurate data on process metrics is crucial for making informed decisions, and improving overall productivity. Production monitoring dashboards in Grafana, which can be easily tailored to any company’s needs, provide these real-time insights in a visual way. As a result, they replace process hindsight with a proactive, and more profitable approach.
How it drives better decision-making:
- Identify bottlenecks, inefficiencies or quality issues when they occur, not after the facts
- Get real-time insights into the status of production, even on your phone
- Provide insights at the level of equipment, line or across the whole production hall
How it improves production operations:
- Save costs by optimising line performance and eliminating downtime
- Optimise resource allocation based on real-time production data
- Respond swiftly to small issues, before they impact process continuity
- Implement a continuous improvement process and measure the results
2. Water monitoring dashboard 💧
Water usage is a substantial cost for manufacturing companies. With rising utility costs, having accurate data on consumption for each part of the production process is a necessity. Building a water monitoring dashboard in Grafana empowers you to track water usage in real-time and combine KPIs in custom interfaces for operators and managers.

How it drives better decision-making:
- Identify primary resource usage
- Obtain insights into the efficiency of conversion equipment (e.g. gas to steam)
- Integrate data and link water usage to production runs, batches, etc.
- Compare current water consumption with previous production runs
- Display the actual cost per amount of product in manager dashboards
- Compare real-time water consumption data with historical values
How it improves production operations:
- Find the biggest consumers within your plant or production lines
- Identify water-related production issues and improvement potential
- Set priorities within a sustainability roadmap and follow-up on progress
- Drastically lower your plant’s water use, improving the bottom line
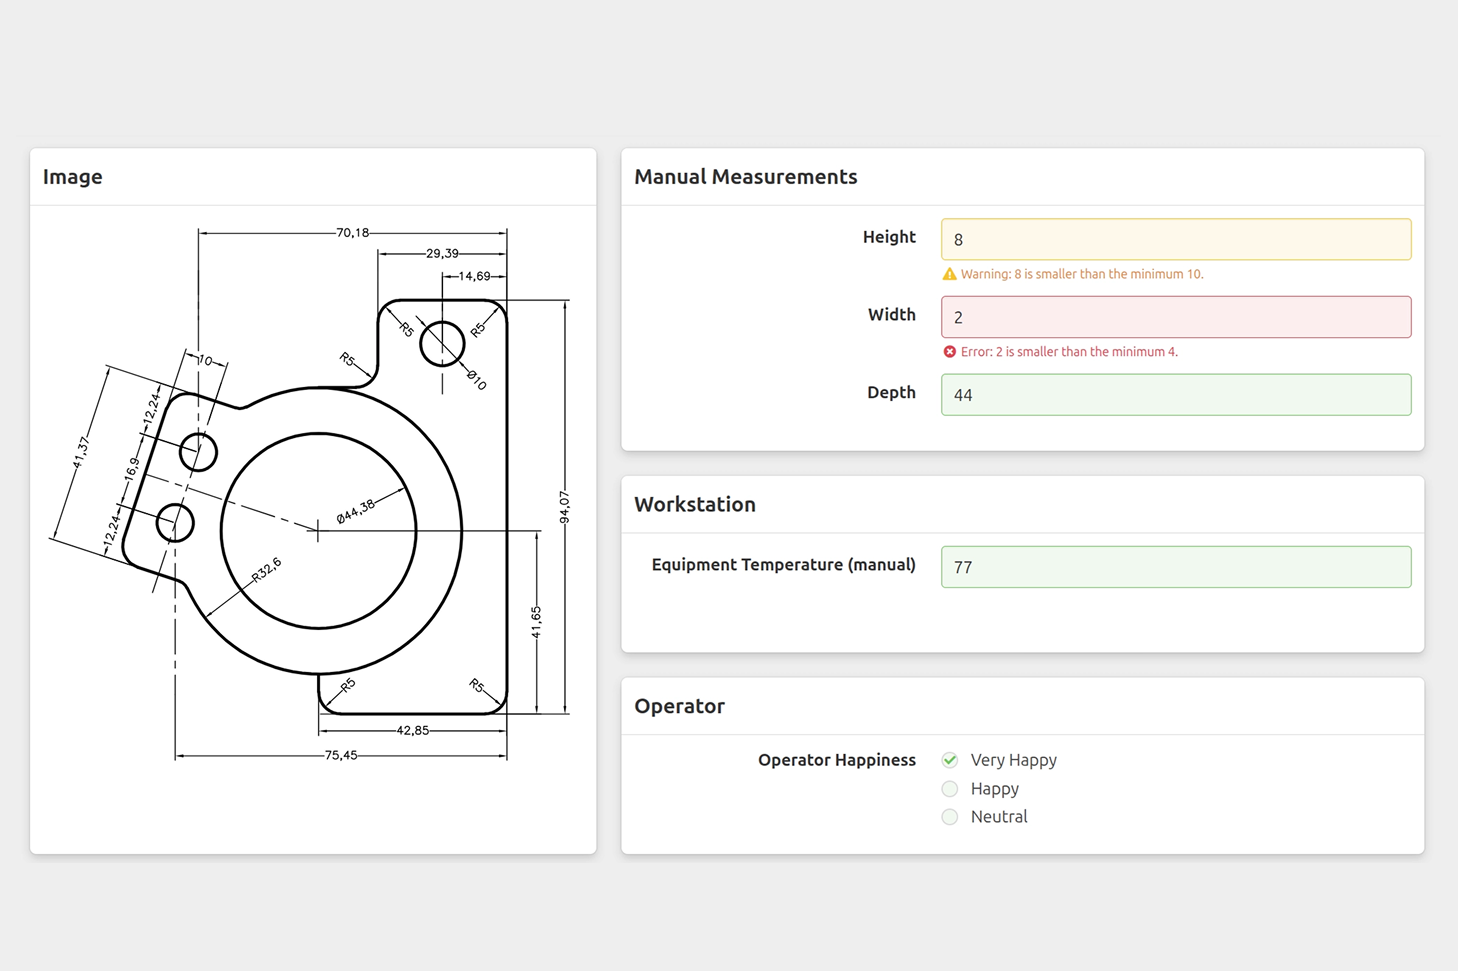
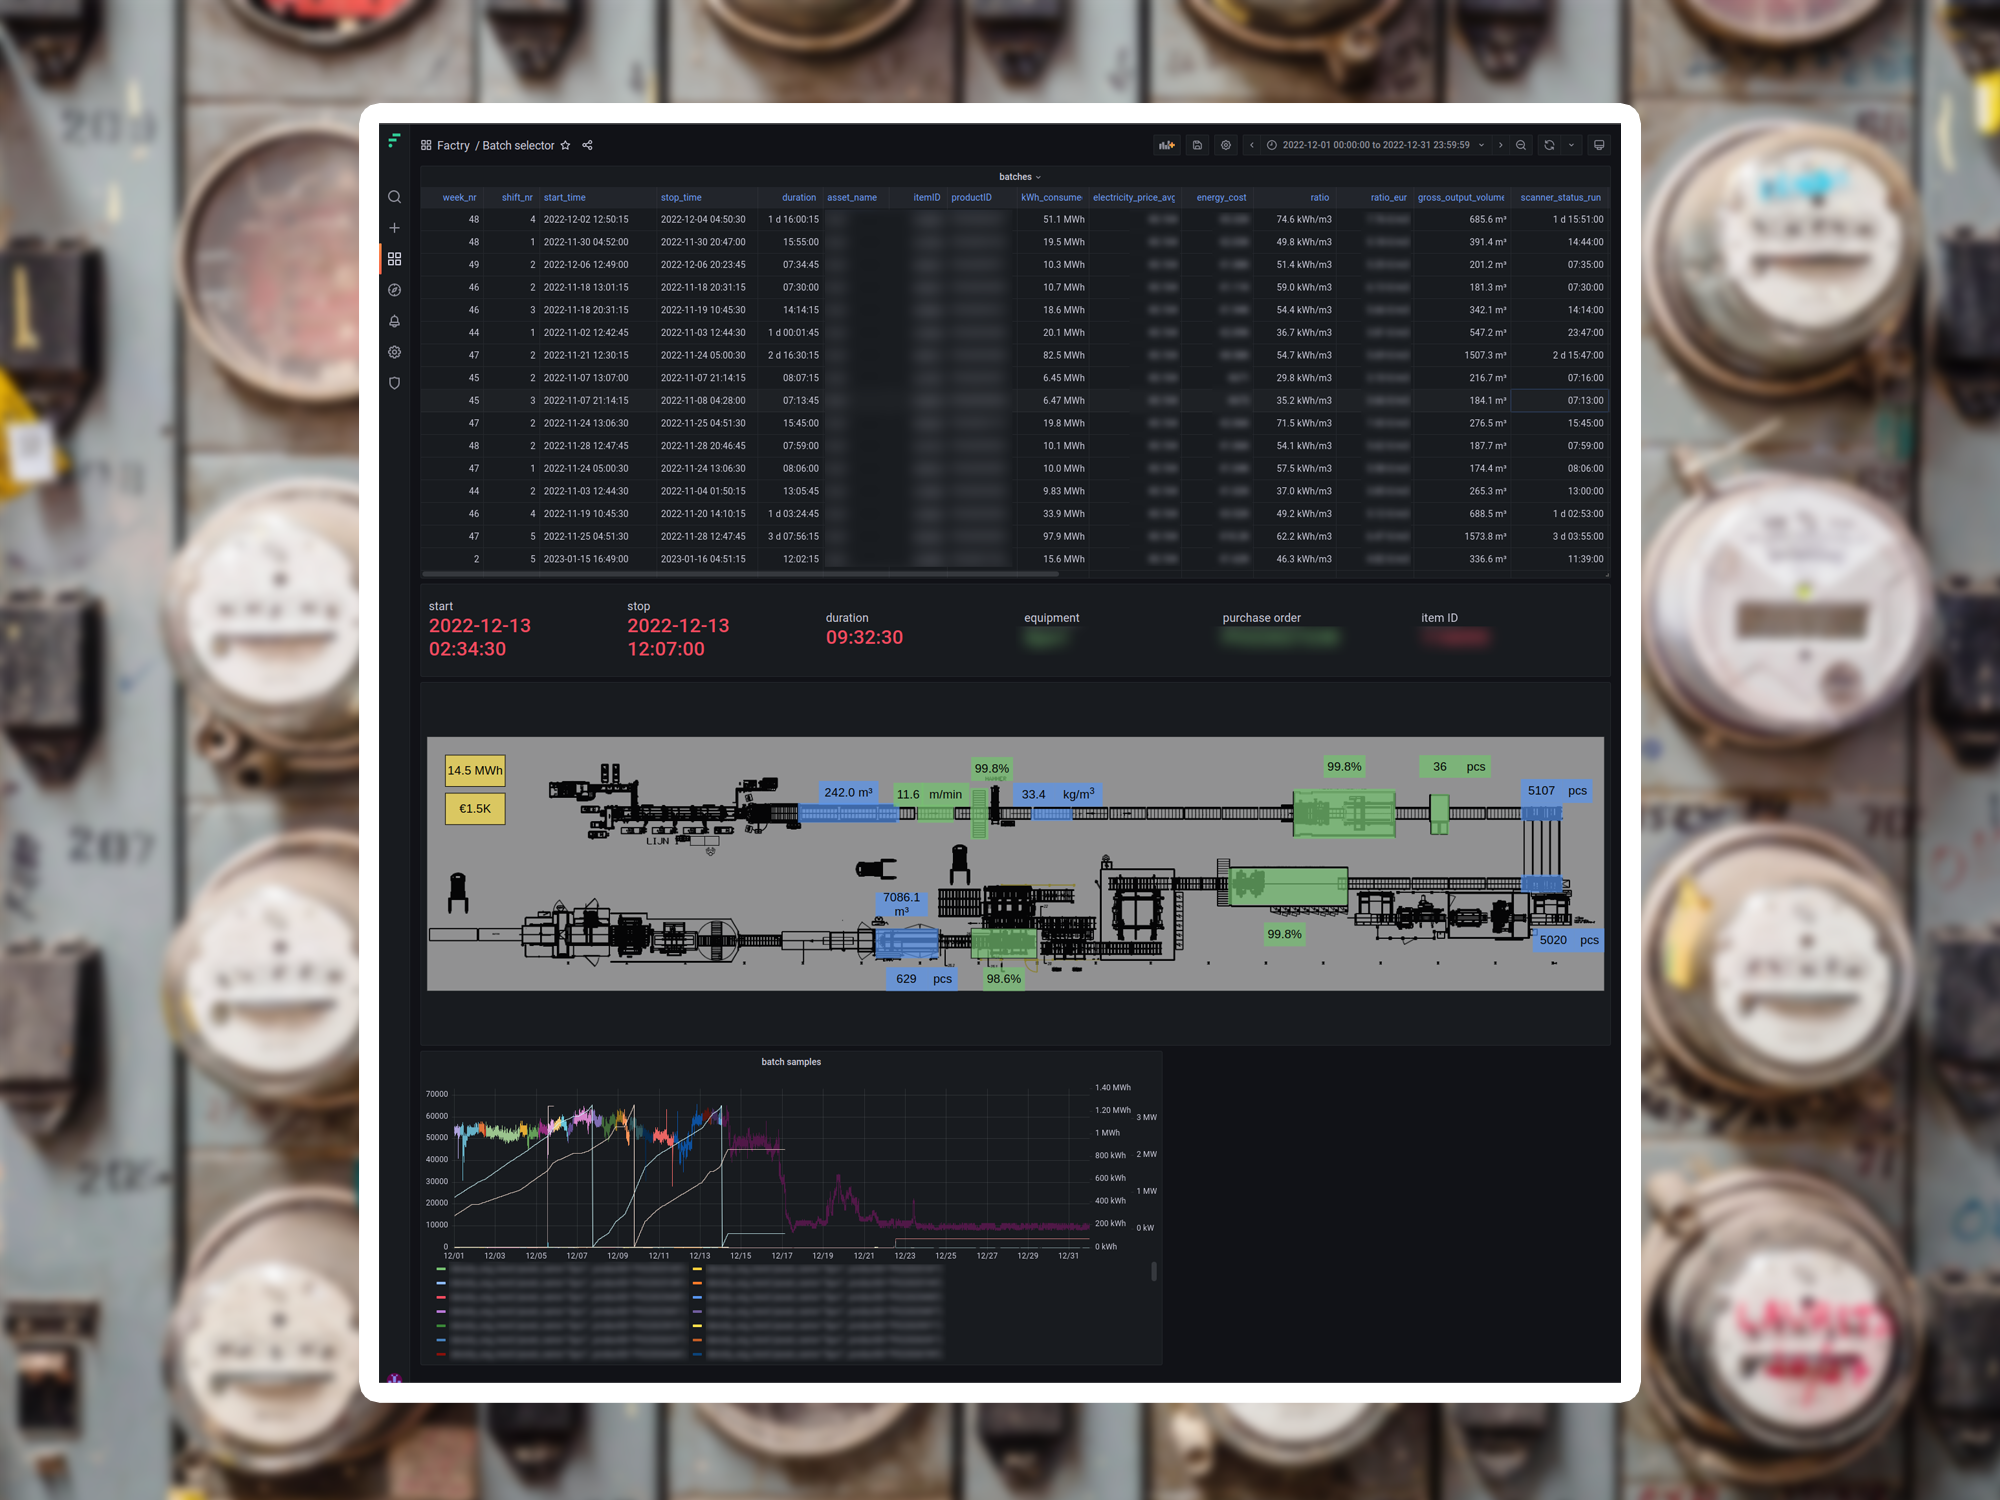
3. Batch analysis dashboard 🏆
Batch-based process manufacturers, such as companies in the food and chemical industry, rely on the consistent and repeatable production of high-quality products. A batch analysis dashboard, suited to make a thorough analysis of batch parameters, provides real-time visibility into the key process variables that may impact product quality, efficiency and ultimately client satisfaction.

How it drives better decision-making:
- Compare batches produced with different recipes, input materials or equipment
- Quickly identify and address issues that may impact product quality
- Analyse historical process data to identify hidden trends and patterns
- Zoom in and out on individual process values and equipment parameters
How it improves production operations:
- Improve the consistency and repeatability of the production process
- Find the Golden Batch by comparing real-time with optimal conditions
- Implement a continuous improvement programme and track the results
- Make more informed decisions around suppliers and raw materials
4. Industrial asset monitoring dashboard ⚙️
Asset monitoring dashboards allow clients to identify and address (remote) equipment issues promptly and plan preventive maintenance. Visual Grafana dashboards empower managers to benchmark the performance of multiple assets and continuously improve. As a result, they can eliminate unplanned downtime and reduce operational costs.

How it drives better decision-making:
- Follow up on asset performance in real time
- Get instantly alerted in case of deviating parameters
- Compare the performance of production assets, in one glimpse
- Access Grafana dashboards from anywhere, on any device
How it improves operations:
- Save costs by eliminating waste and unplanned downtime
- Identify best practices and areas for operational improvement
- Increase the utility of production assets, leading to higher profits
- Enjoy a limitlessly scalable system – without breaking the bank
Read more about Factry Historian: the flexible data collection solution for Industry 4.0, used by companies in nearly 30 countries and 5 continents.