What is batch analysis
Batch analysis is the practice of comparing production batches, runs made from the same recipe, on the same line, under nominally the same conditions, to understand why some perform better than others. In process manufacturing (food and beverage, pharma, chemicals, and other batch-based industries), no two runs are ever perfectly identical. Batch analysis is how you find out which small differences actually mattered.
At its simplest, that means lining up two batches' process data (temperature, pressure, pH, whatever the critical parameters are) and looking at where they diverge. At its most useful, it means having a trusted reference, often called a "golden batch," that represents your best-performing run, and continuously checking new batches against it.
Why batch analysis matters
The business case is straightforward: batch outcomes vary even when the recipe doesn't, and that variation costs yield, wastes raw material, and puts quality at risk. A process engineer or plant manager whose team can't explain that variation is stuck reacting to it batch by batch instead of preventing it.
There's also a credibility angle that matters more than it gets credit for. "We improved yield by doing X" only holds up in a budget review if there's real batch history behind it, a consistent before-and-after, not a single case someone put together once. Good batch analysis is what makes a yield or quality claim defensible rather than anecdotal.
Common methods
A few named approaches show up repeatedly across process manufacturing:
Golden batch comparison. Pick your best-performing historical run as a reference, then overlay new batches against it to spot deviation early. This is the most widely used method and the one most vendor tools are built around.
Phase-based comparison. Rather than comparing whole batches start to finish, break each batch into its process phases (heating, holding, cooling, whatever applies) and compare phase durations and behavior individually. Useful when a batch's overall time varies but the interesting differences live inside specific phases.
Maturity-variable normalization. Batches rarely take exactly the same amount of time, so comparing by elapsed time can be misleading. Normalizing by percent-complete instead of clock time lines up batches by progress rather than duration, which tends to produce a cleaner comparison.
Statistical process control (SPC) on batch data. Applying control limits and multivariate techniques to batch data to flag when a run has drifted outside normal variation, rather than relying on someone eyeballing a chart. Sartorius has a solid technical explainer on the statistical methods (PCA, PLS) behind this if you want the deeper math.
None of these methods are exotic. Most batch analysis software, including Factry's, supports some combination of all four.
The prerequisite nobody mentions
Here's what every one of those methods quietly assumes: that your batches are already structured consistently enough to compare. That assumption is usually wrong, and it's the actual reason batch analysis feels harder than it should.
Batch 47 and batch 48 don't automatically agree on where a batch starts and ends. If that boundary depends on someone logging it by hand, or deciding after the fact where they think the batch began, it's not a repeatable process. It still requires people doing manual reconstruction every time someone wants a report compiled.

So the golden batch comparison chart, phase-based view, or SPC control limits, all genuinely useful, are only as good as the batch structure underneath them. A beautiful overlay chart built on inconsistently-tagged batches is comparing whatever happened to get logged carefully that week, not a real population of runs.
What good batch analysis requires in practice
A few things need to be true before any of the methods above produce something trustworthy:
Batches need to be detected automatically, not reconstructed by hand after the fact. Start and end of batch should be identified from the process data itself, consistently, regardless of who was on shift.
Every batch needs to be structured the same way, whether it ran on Monday's shift or Thursday's, on the original line or the one that got a new PLC last year. Otherwise your comparable dataset quietly shrinks to "the batches someone happened to tag carefully."
The golden batch reference needs to stay valid over time. If new batches aren't structured the same way the reference batch was, the comparison degrades slowly, and nobody notices until yield does.
This is what automatic event detection and batch contextualization actually solve for, not a nicer chart, but batches that are comparable by default because they were structured consistently as they were captured, not stitched together afterward. It's also why Agristo's data engineering team specifically called out batch overlays becoming "indispensable for troubleshooting" once that structure was in place, the overlay itself wasn't new, being able to trust what it showed was.
Getting started: where does your team sit today?
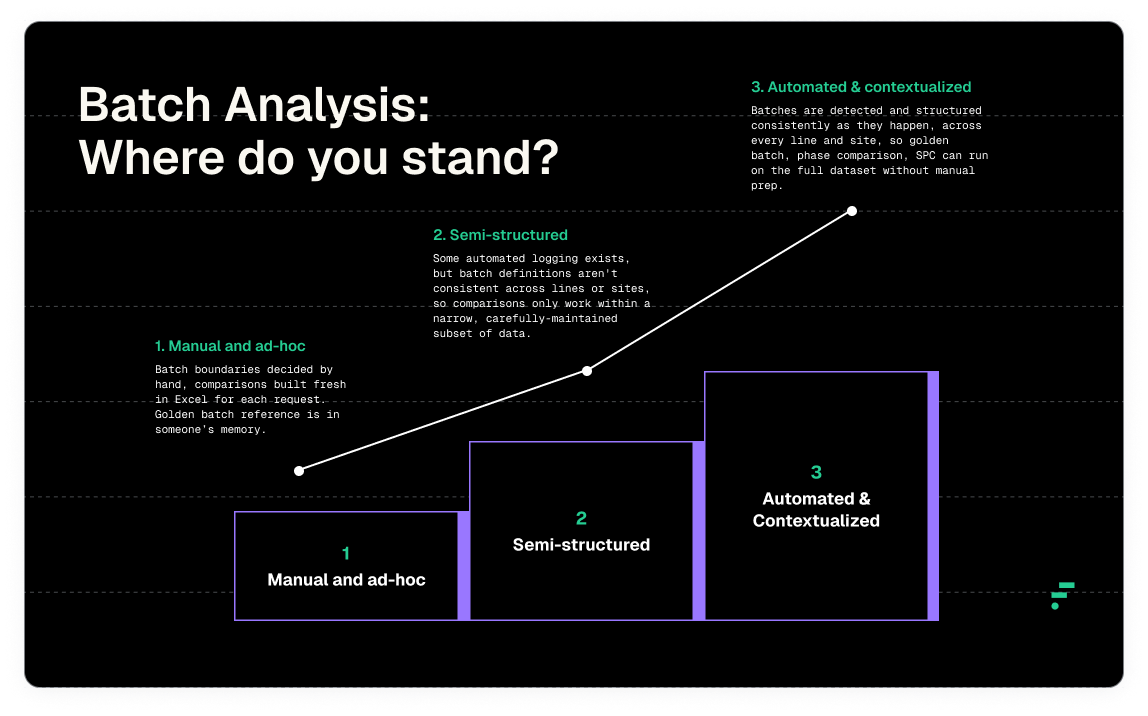
Most teams land somewhere on a rough maturity path:
- Manual and ad-hoc: batch boundaries decided by hand, comparisons built fresh in Excel each time someone asks. Slow, and the golden batch reference is really just "that one good run someone remembers."
- Semi-structured: some automated logging exists, but batch definitions aren't consistent across lines or sites, so comparisons only work within a narrow, carefully-maintained subset of data.
- Automated and contextualized: batches are detected and structured consistently as they happen, across every line and site, so any method above (golden batch, phase comparison, SPC) can run on the full dataset without manual prep.
If your team is doing real analysis but it still takes an afternoon of data wrangling before anyone opens a chart, you're most likely stuck at the semi-structured stage, closer than it feels, but still paying the manual-reconstruction tax every time.
FAQ
What's a golden batch?
A golden batch is a reference run, usually your best-performing historical batch for a given recipe, used as the benchmark that new batches get compared against to spot deviation early.
Can you compare batches that ran on different lines or at different plants?
Only if both lines or sites structure their batch data the same way. This is usually the actual blocker in multi-site comparisons, not the analysis method itself, similar to the broader data fragmentation problem that shows up across process manufacturing generally.
Do I need machine learning to do batch analysis well?
No. Most of the value comes from consistent batch structuring and straightforward comparison methods (golden batch, phase comparison, SPC). Statistical and ML-based techniques add value on top of that, but they don't substitute for having comparable, well-structured batch data in the first place.
If your team is already doing some version of this and wants to see what automated batch detection and contextualization looks like in practice, the Batch Reporting use case walks through it directly, or take a broader look at Factry Historian if you're earlier in figuring out whether your current data setup can support this at all.

.png)