With v6.0 of our IIoT platform Factry Historian, we’ve wrapped three distinctive new features in one major product update. What is new? And what is the added value to your operations? Here’s all you need to know about our latest v6.0 release.
🥁 Here's what to expect:
A user-friendly analysis interface for non-technical end users
The ability to enrich process data through custom data entry screens
Advanced multi-site data management with simplified user access
Missed the release webinar?
Enter your details below and watch it on-demand.
1. Factry Historian data source for Grafana
Before, Grafana was connected directly to Factry’s underlying timeseries database InfluxDB. This worked, and still works like a charm: people can visualise data or draw reports in only a matter of seconds.
However, for lots of users, it was not always easy to find their way in a long list of tags. That is why we focused on making data more accessible to non-technical people.
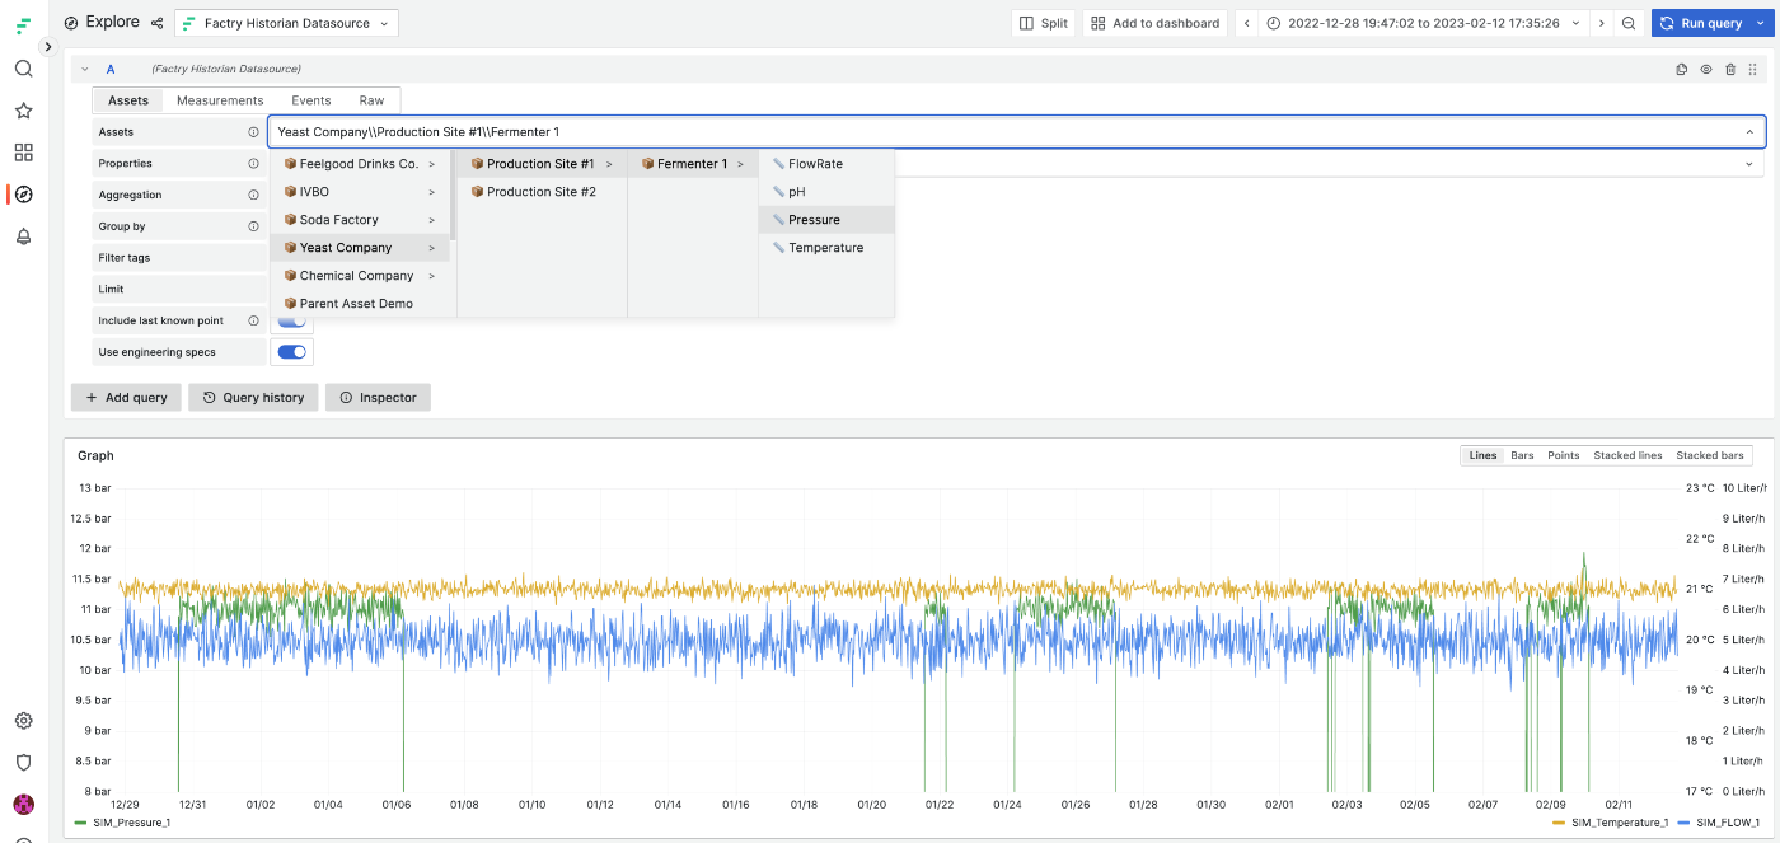
By popular demand, we’ve built a Grafana data source on top of Factry Historian. This new data source allows users to trend time-series data and analyse events, such as batches or shifts, without technical skills.
Here's what's new:
A visual asset tree in Grafana
The unit of measurement, min and max of tags is included by default
Events are now easy to query with Grafana, without SQL
Visual plant and asset architecture
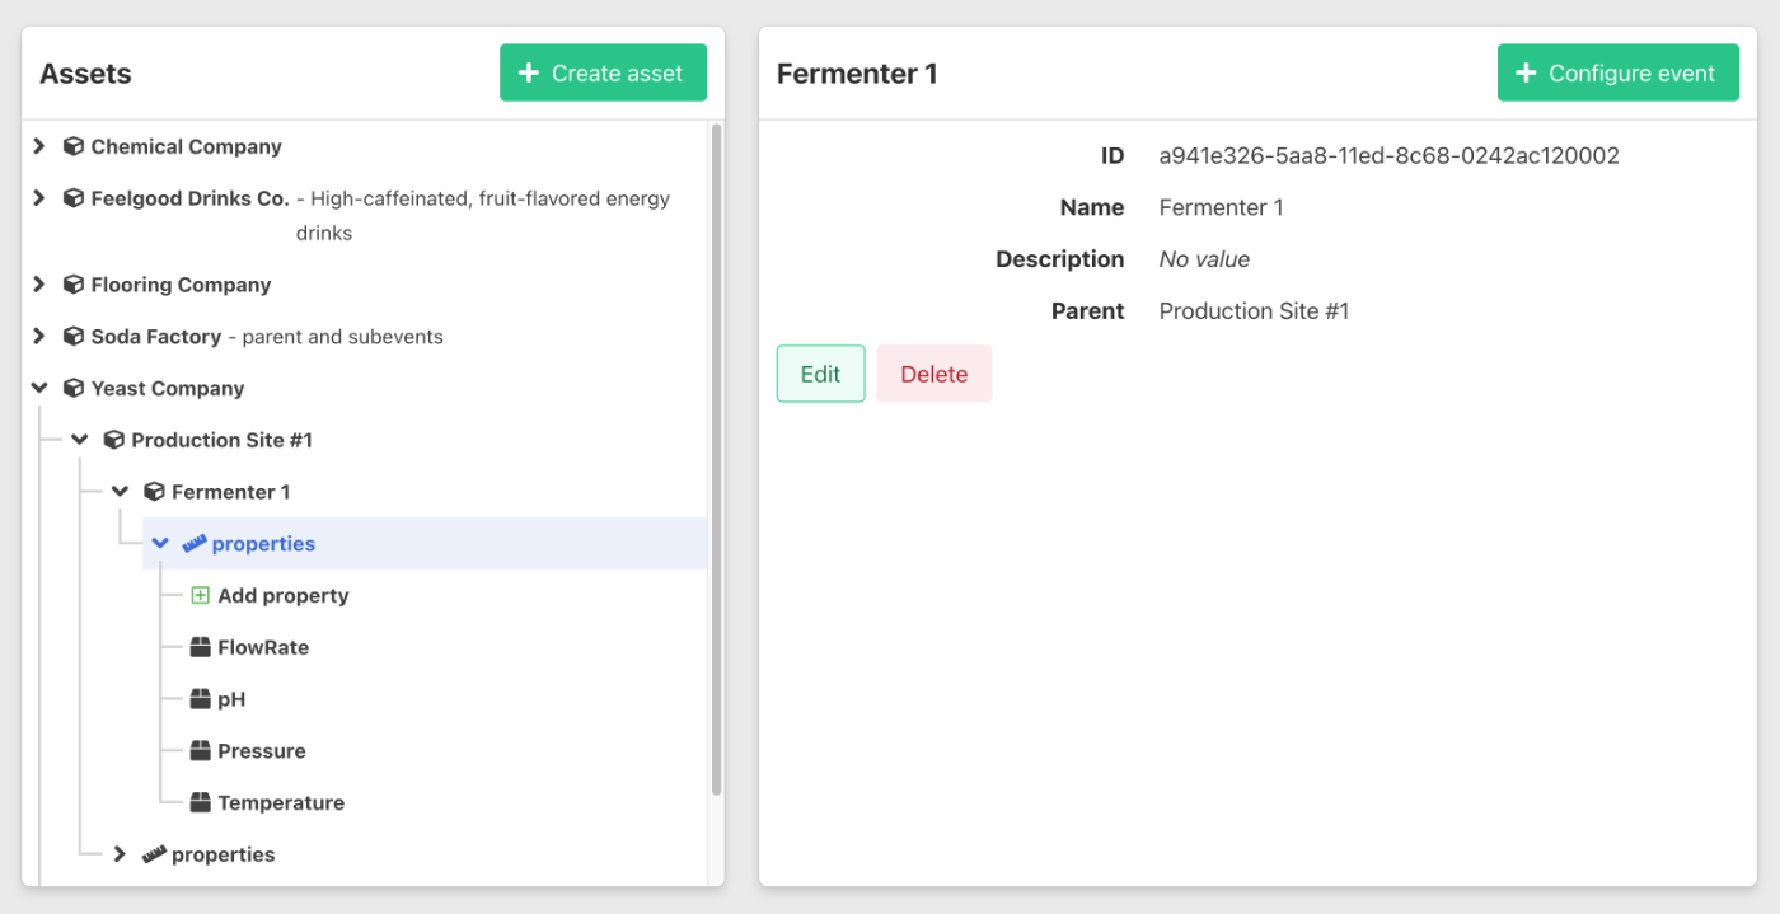
Business users are now able to browse the factory equipment through a visual asset tree. From there, they can easily find production assets they are looking for, analyse events, draw graphs or reports, and surface new data insights. Instead of having to wander through technical descriptions, they can now view and select assets through a simplified asset structure. The temperature of asset ‘AG67.09X5’ becomes e.g. ‘Fermentor A > Temperature'.
User-friendly process event analysis
The previous v5 upgrade included an event detection & analysis module. This module makes it possible to configure and detect any event in the production process with a start and an end time, for example a batch.
Through the Grafana interface, and by selecting the right production asset from the asset tree, business users get easy access to any asset, the events (e.g. batches, orders, downtime) detected on it, and the properties calculated on events.
Pre-defined event parameters can be selected from a dropdown list, and combined on-the-fly in a comprehensible graph or report.
For example
The company's facility manager wants to investigate utility consumption per production shift on a specific production line. For this, he or she needs the total amount of produced goods, and the energy and water usage during the production event.
The facility manager would select the appropriate production line from the asset tree, select the ‘shift' event -- and voila, all properties for shifts in the Grafana time range are now available.
Units of measurement now included
Let’s say your enterprise has a plant in the EU and the US. Temperature data in °C or °F can make a huge difference. The new data source displays the data in the correct unit of measurement, adding a layer of valuable context.
As the full spectrum of engineering specifications (UoM, min and max for y-axes, as well as HI and LO limits) is sent along, the correct measurements are now transparent for everyone – and not just for engineers.
Again, this makes it easier for non-technical people to analyse event data.
Factry Historian
The open data management platform for Industry 4.0
No matter how hard you try automating processes, there are always situations in which automated data collection just isn’t possible. Adding lab test results, for example, or adding data from a manual check-up by a machine operator.
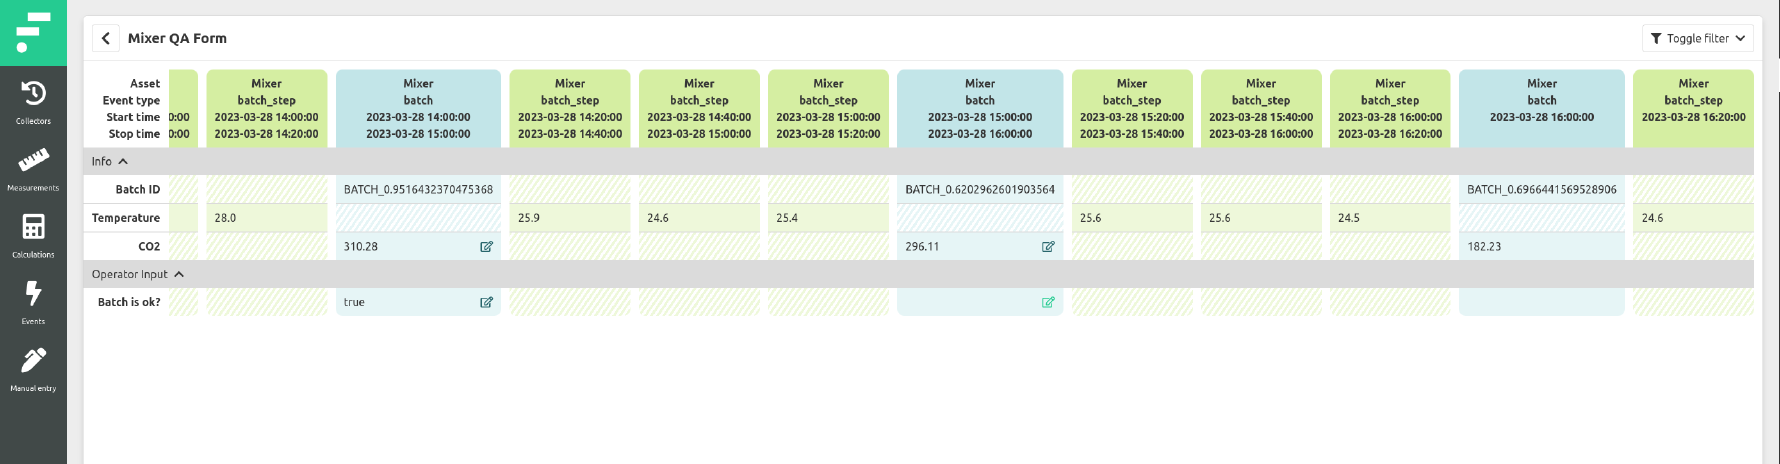
For that reason, we have developed a manual entry tool for Factry Historian. Managers can now build custom screens for machine operators or any other company role, so they can manually add parameters to process events.
All within the historian, without having to write a line of code.
Imagine that each week, a test is performed on a series of storage tanks. For this manual sampling, a separate event can be created, with specific parameters on how and when it was performed, and which properties to add.
The power of this new feature is mainly in enriching your production data in a simple and effective way, thereby bridging the final gap between today and becoming a fully paperless plant. And which company wouldn’t want that?
3. Advanced multi-site data management
The third pillar of our V6 update is aimed at industrial companies that consist of multiple sites – including many of our clients. For them, we wanted to make the historian even more compatible with an enterprise set-up.
That is why we focused on:
A multi-tenant system interface
Simplified, one-fits-all authentication
Privileges-based user management
A multi-tenant historian interface
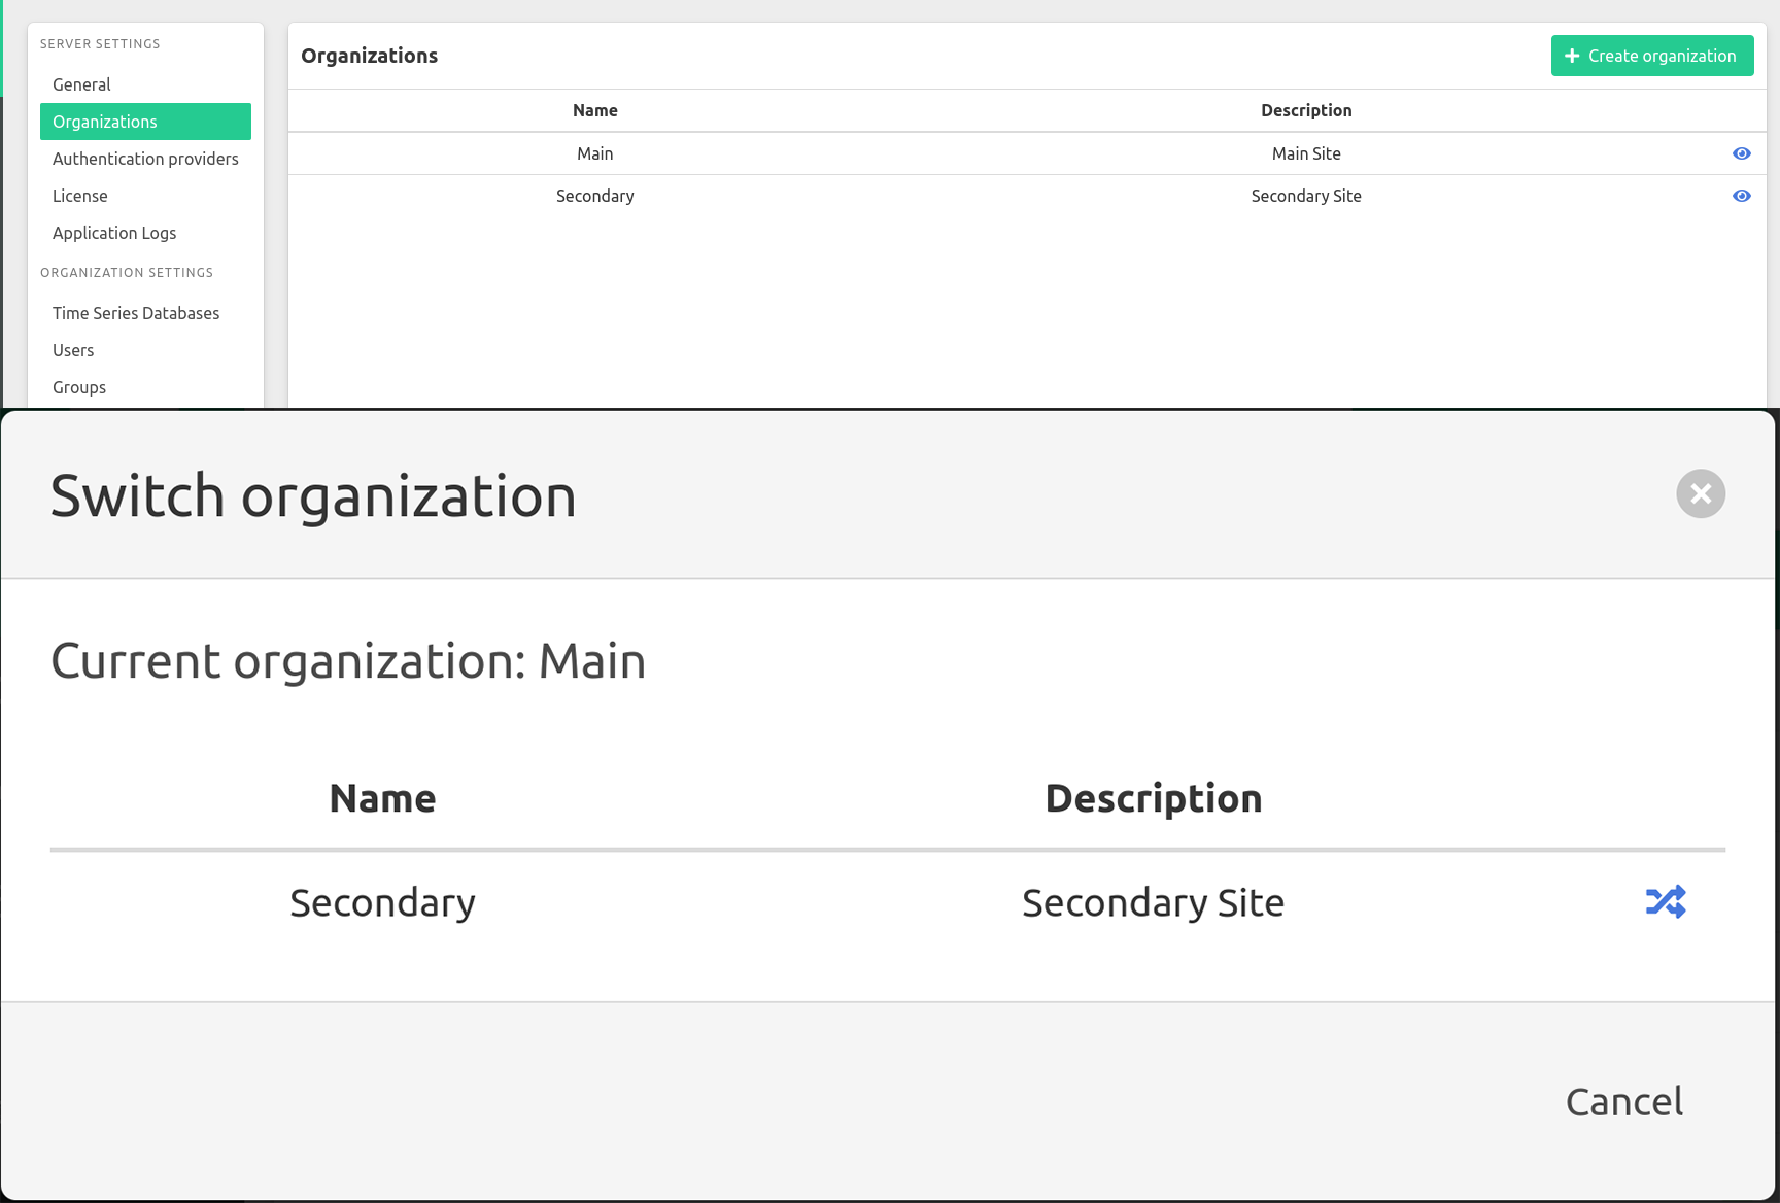
An improved multi-tenant environment enables users on the enterprise level to switch between organisations, within the same interface, in one click. For each organisation, different subsets of measurements can be made available.
For example, managers on the corporate level can access global system settings, while local automation engineers can only access local production data.
What's new:
Separate Factry Historian management per organisation
Switch between organisations in one click
Assign different access rights to different roles in different organisations
Simplified user authentication
From now on, it is possible for users to access the IIoT platform through additional authentication methods: through a standard Google or Microsoft account with OAuth, or LDAP with Active Directory.
The core benefit of centralising user authentication is that it is no longer needed for IT to manage two sets of users. Employees can now log onto Factry Historian using their standard business account. Fast and simple.
This also means that in case the corporate account of employees is suspended, they will automatically lose access to the historian platform.
Fine-grained user management
By creating privileges-based user groups, system administrators can now grant or deny access to specific functionalities of the application. This allows for a much more fine-grained user management.
Configuring groups is easy: users can be assigned to one or multiple user groups with specific or standard privileges. For instance, you can now link a group of Active Directory users to have viewing rights for manual entry forms.
What's new:
Create and modify user groups with certain privileges
Specify access rights for any aspect of the application
Bonus feature: Documented Historian API
While finishing off the V6 update, we also took the opportunity to document our Factry Historian API to Swagger specs standards. From descriptions to endpoints, available measurements and filters: it’s now all documented to the bone, allowing you to create custom API integrations even more smoothly.
So, less hassle, and more peace of mind.
See Factry Historian V6 in action
By further improving the maturity of the historian’s multi-organisation set-up, facilitating user accessibility, and taking the last hurdle towards paperless operations, we’re sure that this update will add huge value to our clients.
Have any questions about the V6 release of Factry Historian? Feel free to contact our team. Or schedule a demo right away.
Meet Factry Historian
The open data management platform for Industry 4.0