How open source software is revolutionising Industrial IT
Open source tech is rapidly changing the way industrial companies think and strategise. What does this shift toward open source mean for them?
Jeroen Coussement on , updated
At Factry we have got many years of experience with getting data out of industrial automation systems. Recently, one of our clients asked us: “We’ve got some algorithms that send their results to InfluxDB. Can you get this data back to our SCADA automation system?‘. Basically, this means the opposite of what we typically do: instead of getting data out of the control system, can we get the data back into it? Challenge accepted!
We decided the best way to do this was by building an OPC-UA server that exposes the data stored in a time series database such as InfluxDB as individual nodes. This way, the SCADA system can connect to this server and read the data at the interval it needs. (Note: for our use case we only needed to expose the most recent value, but we can imagine applications where e.g. averages in the last 15 minutes could be useful.)
Typically, PLCs and SCADA automation systems are running ‘stand-alone’, using little to no external data for real-time control of industrial process. This is desired because of reliability: you want real-time control that is not interrupted by possible network interruptions or service unavailability.
Nonetheless, in some more advanced cases you might need additional, third party data that is not easily made available to the SCADA system to optimise the operation of your assets. As this kind of control is less critical, part of this logic can be performed on a higher level with more design freedom and sent back to the SCADA system. Some examples can be:
We built the server in NodeJS. Just like in the node-OPC-UA-logger project, we used the node-OPC-UA library for the OPC-UA connectivity. For access to influxDB, we used the official node Influx Client for node.
The logic is quite straightforward. When an client requests a value from our server, we query influxDB for the value, assign the correct OPC-UA data type and return it to the client. In the next parts, we discuss some of the challenges that we encountered and how we solved these:
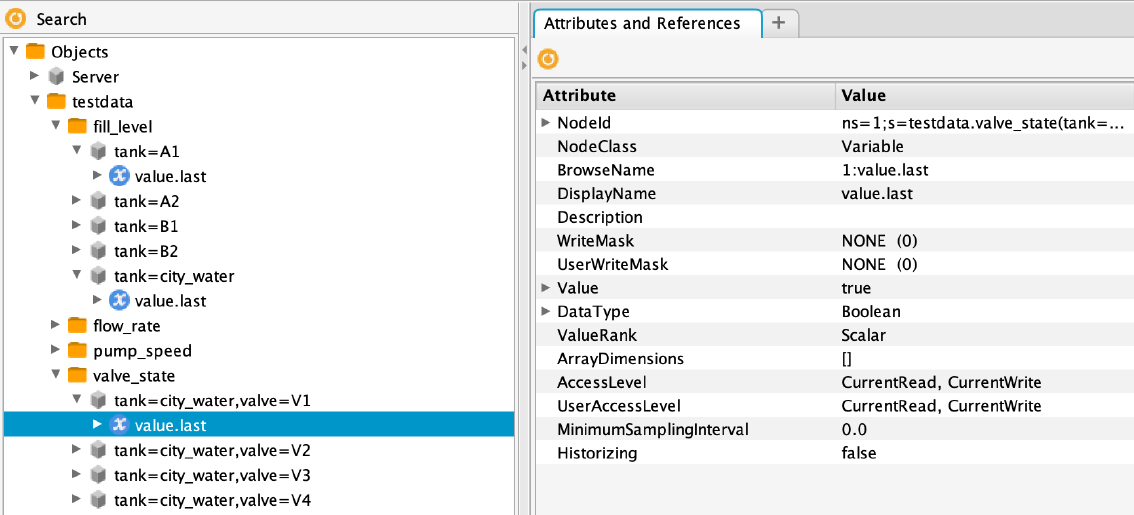
While Influxdb is schemaless, the OPC-UA protocol in itself has a hierarchical structure in which the data is exposed as individual nodes. This hierarchical structure in OPC-UA is browsable, and the value of individual nodes (which typically represent sensors, memory addresses in a PLC, etc.) can be by accessed based on their NodeID. This presented the first challenge: how do we build a tree structure from a given InfluxDB schema? After some consideration, we decided ‘flatten-out’ the schema and present it in the following way:
Wile InfluxDB exposes a fully featured query language to handle extracting data in multiple ways from the database, OPC-UA is exposing a real-time view on the data*, where the value of an individal node is accessed through its NodeID. You can read or subscribe to the value of a OPC-UA node, but you can’t easily specify a time window or perform an actual query to transform and request the data.
*There is something called OPC-HDA in the old OPC protocol, and the HistoryRead function in the OPC-UA standard, but both are not widely used and we do not think they are relevant for this application.
To tackle the tags vs. hierarchy challenge, we decided to flatten out the InfluxDB schema and present it in the following way in the OPC-UA server address space:
Objects
  |- Database1
  |   |- Measurement1
  |       |- Tag1=Tag1Value1,Tag2=Tag2Value1
  |       |   |- Field1.last
  |       |   |- Field2.last
  |       |- Tag1=Tag1Value2,Tag2=Tag2Value1
  |           |- Field1.last
  |           |- Field2.last
  |- Database2
      |- Measurement1
         ...
As you can see, the data is first organized by InfluxDB database and then by measurement name. On the next level, all the individual series are flattened out, so that a single entry represents the data linked to the unique tagset of a measurement. Under these series, the individual fields of that series are exposed.
To address viewing real-time vs. historical data, the fields are exposed as pre-defined aggregates, for example last or mean5m or min1h. This way, when the SCADA system only needs the current value, it can subscribe to the field.last nodeID:
ns=1;s=Database1.Measurement1(Tag1=Tag1Value1,Tag2=Tag2Value1).Field1.last
You can see the first implementation of this approach on Github. There are instructions to run it yourself if you want to try it out. You can also connect to our demo OPC-UA server on opc.tcp://OPC-UA-demo.factry.io:51210 using any OPC-UA client. We built this demo because lots of public OPC-UA servers expose dummy data such as random Uint16’s or simple sine waves. Our demo presents a tank system, with a city water tank and 4 smaller tanks A1, A2, B1 and B2. Valves and pumps drain and fill the tanks, respectively. Together, this should present a simple but more realistic demo. Data is prefilled in InfluxDB for the whole of 2019 at second resolution.
We will present a demo on our booth on the Hannover Messe, from April 1-5 2019 in booth F23 in Hall 8. Feel free to come say hi and see the demo in action.
You can visit the fair for free if you register here with ticket code gyc2f.
Open source tech is rapidly changing the way industrial companies think and strategise. What does this shift toward open source mean for them?
In this post we describe 3 real-world cases where Flux brings new and meaningful insights into time series data collected from industrial equipment, ultimately supporting improved decision making.

Read an advanced use case for Flux: a new language for query building in InfluxDB, the time series database behind Factry’s open source Historian.